# load packages
library(countdown) # countdown in slides
library(tidyverse) # data wrangling & viz
library(lubridate) # dealing with dates
library(mgcv)      # estimate penalized Generalized linear models
library(colorspace)# color scales
library(broom)     # turn model outputs to tibbles
library(emmeans)   # estimate marginal means (least-squares)
library(ungeviz)   # vizualize uncertainty
library(ggridges)  # ridgeline plots
library(tidybayes) # tidy bayesian functions
library(dviz.supp) # supplementary materials for C. Wilke's data viz book
library(ggpubr)    # publication ready plots
library(ggtext)    # format ggplot text
library(extrafont) # fonts
library(ggstance)  # horiz flipped stats, geoms; vert flipped positions
library(gganimate) # animated ggplots
library(emo)       # emojis

# set theme for ggplot2
ggplot2::theme_set(ggplot2::theme_minimal(base_size = 14, base_family = "Myriad Pro"))

# set width of code output
options(width = 65)

# set figure parameters for knitr
knitr::opts_chunk$set(
  fig.width = 7, # 7" width
  fig.asp = 0.618, # the golden ratio
  fig.retina = 3, # dpi multiplier for displaying HTML output on retina
  fig.align = "center", # center align figures
  dpi = 300 # higher dpi, sharper image
)

loadfonts(device = "all")Visualizing Uncertainty
Lecture 13
Playing
Image by Wikimedia user Jahobr, released into the public domain.
https://commons.wikimedia.org/wiki/File:Disappearing_dots.gif
Uncertainty in probability
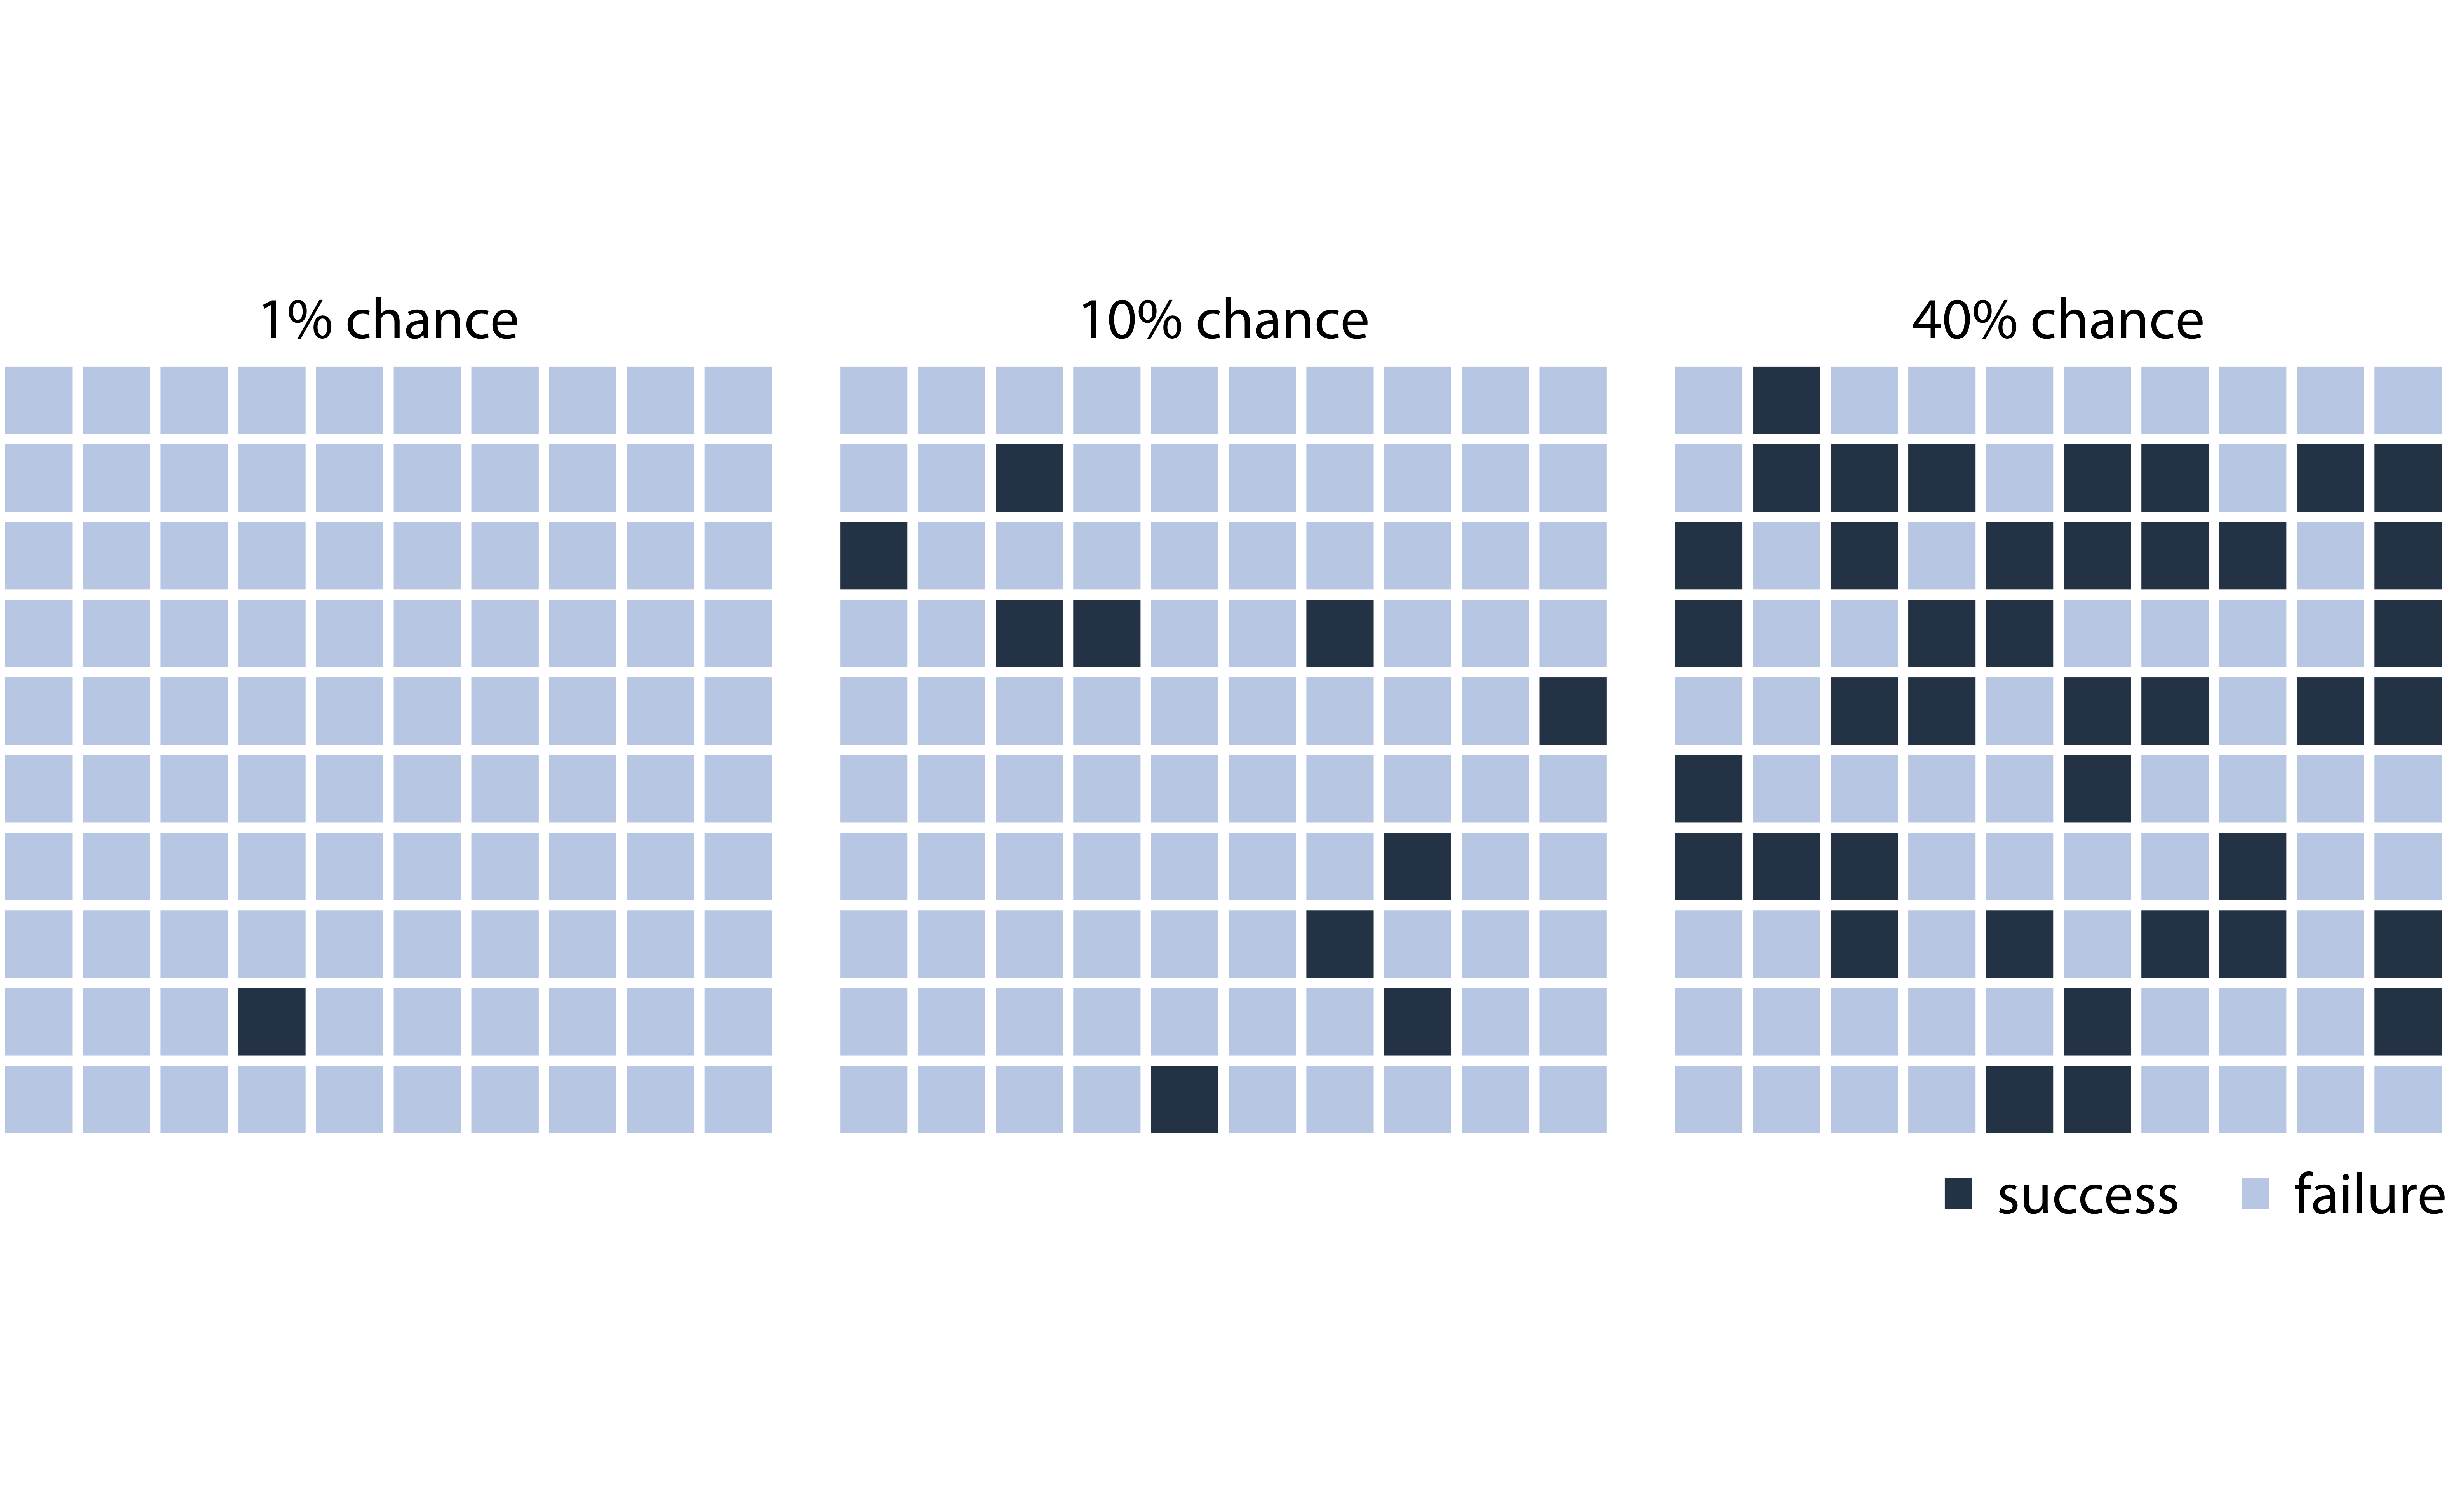
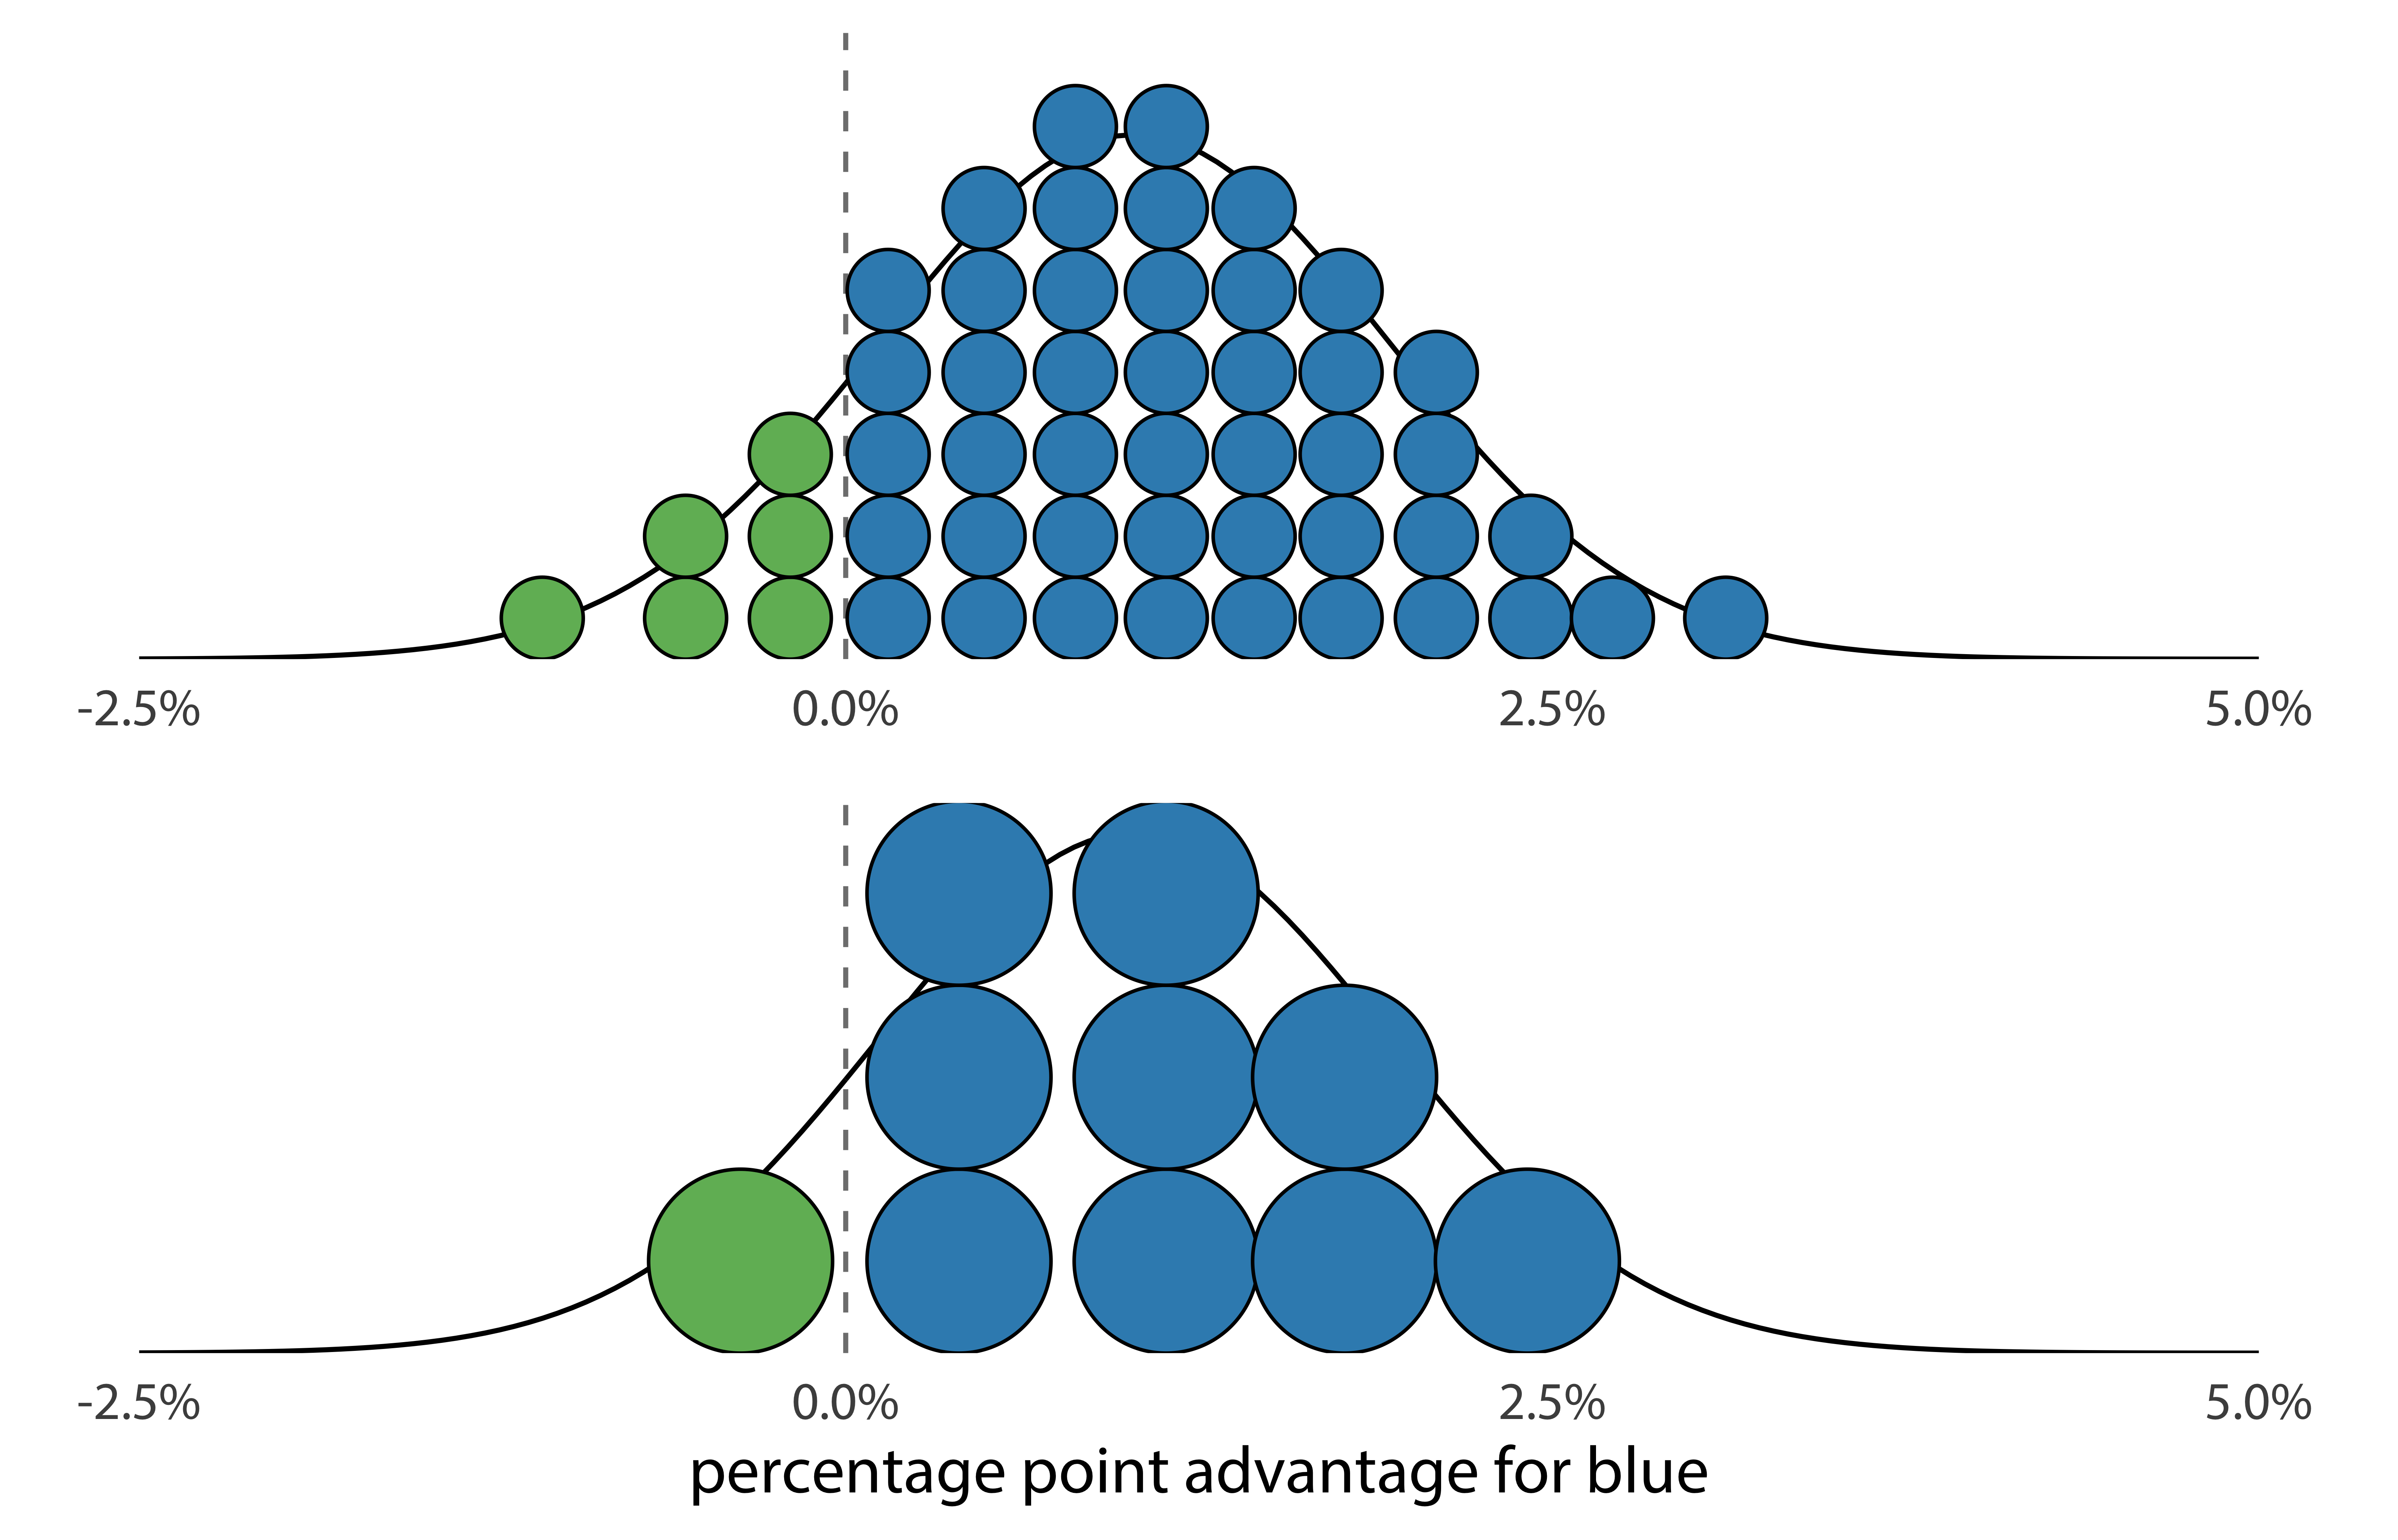
Probability distributions
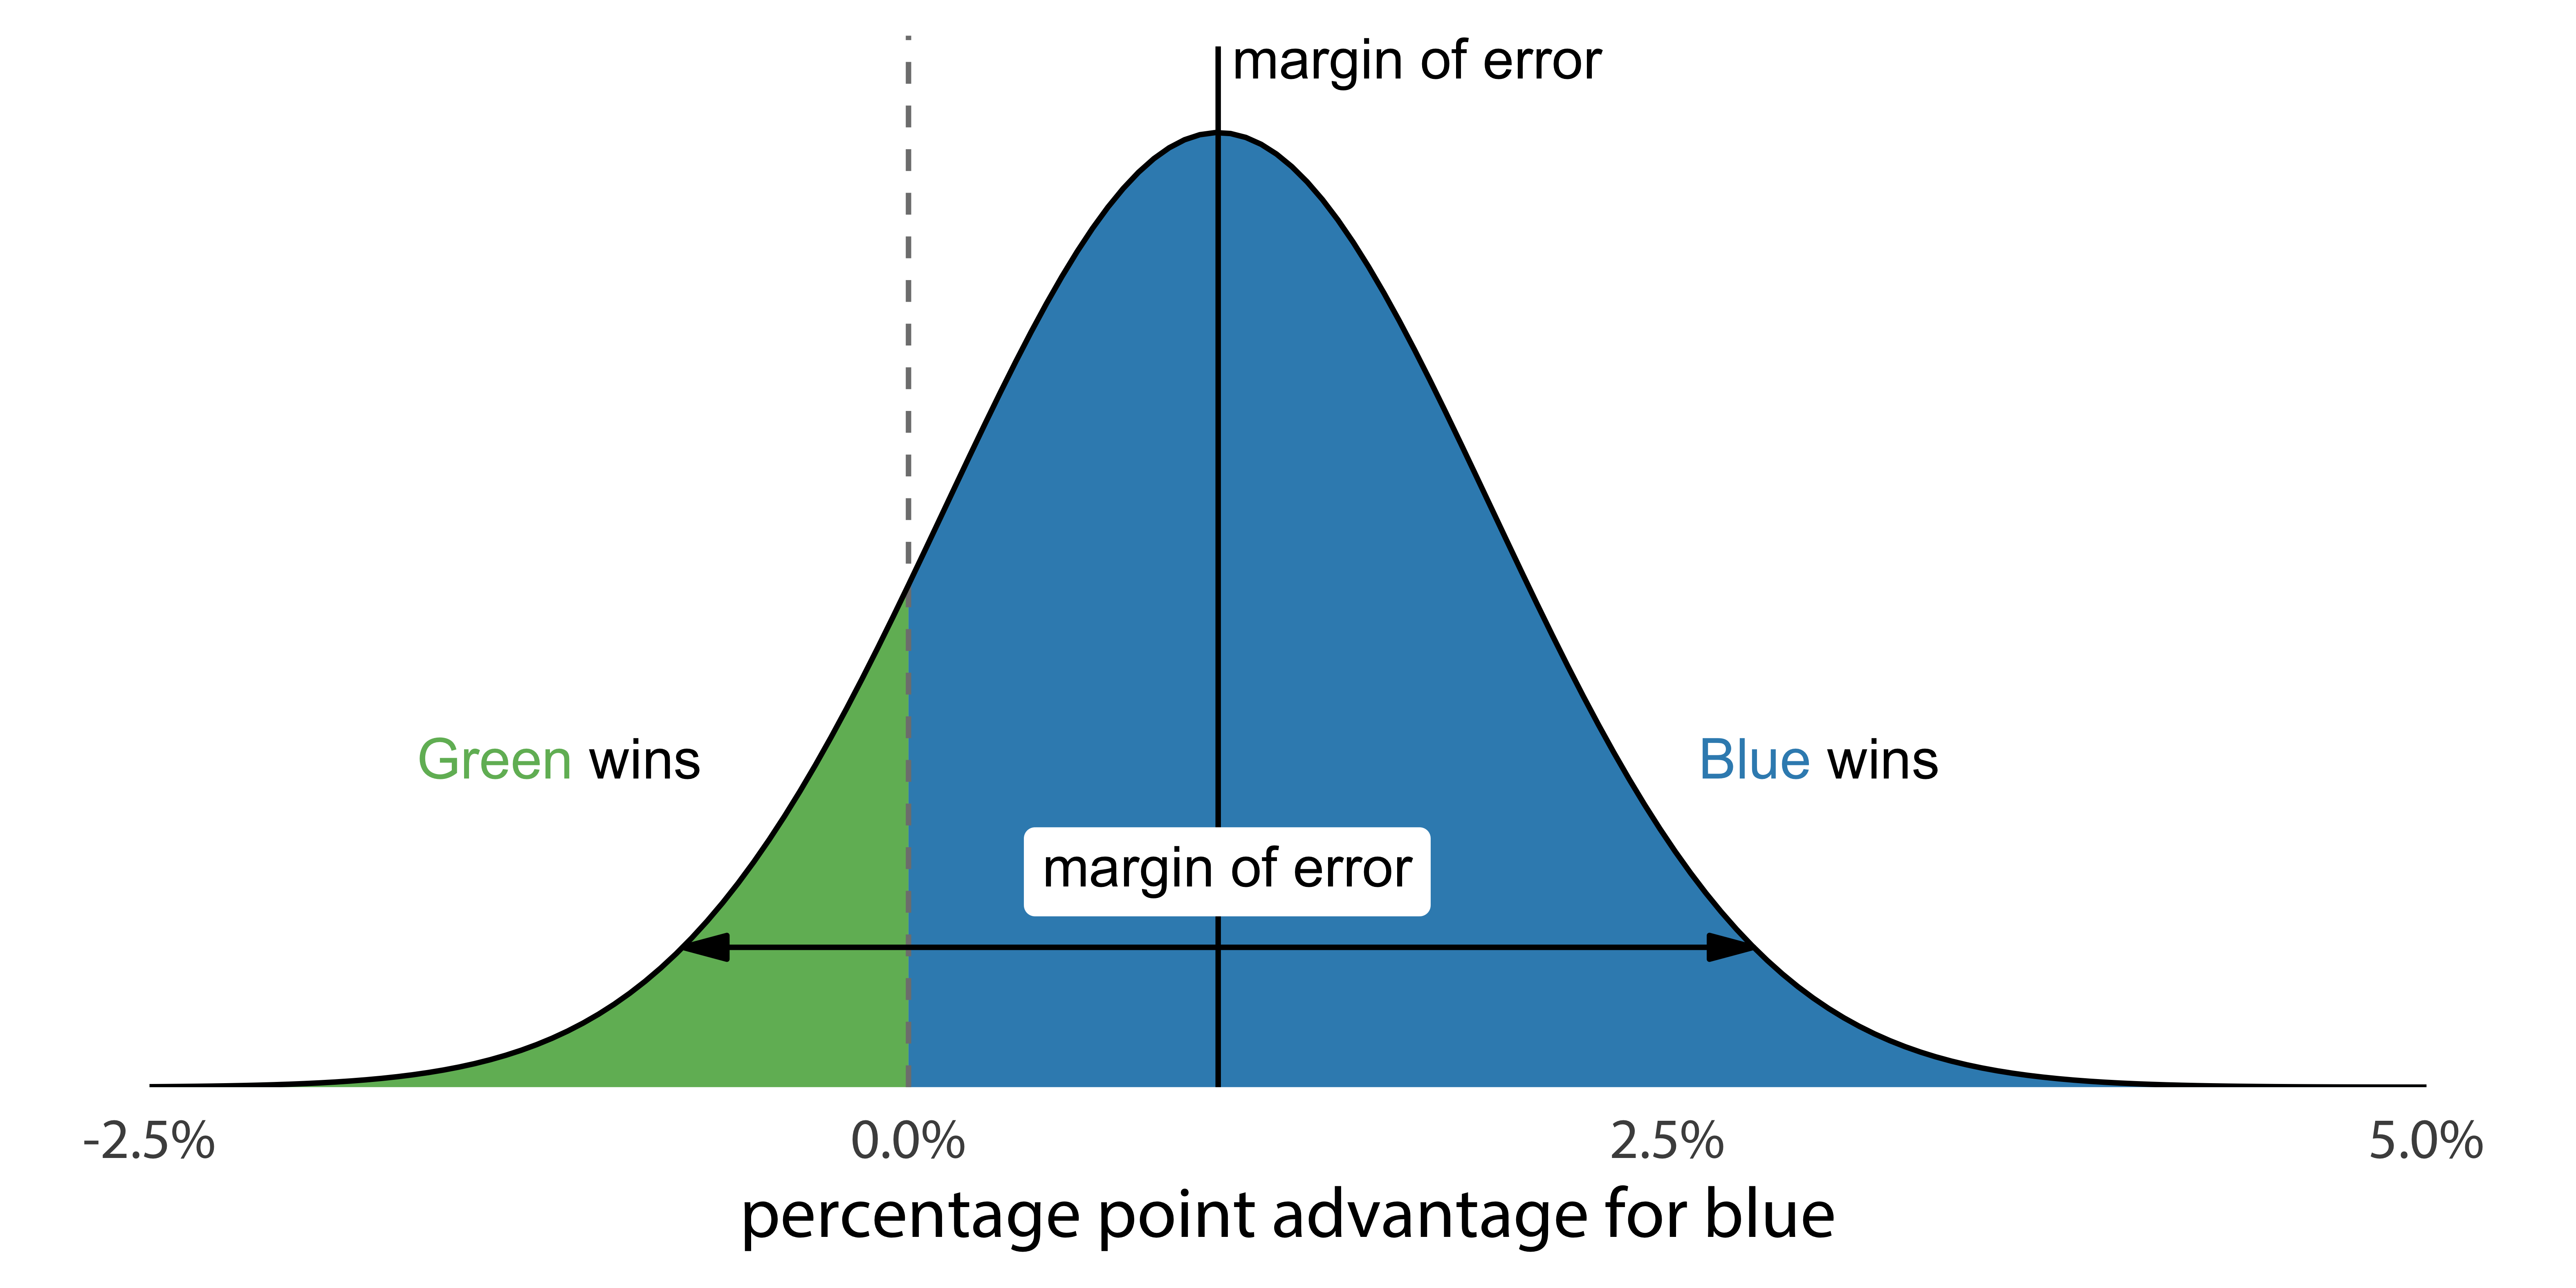
Whats the probability that the blue party wins the election?
Probability distributions
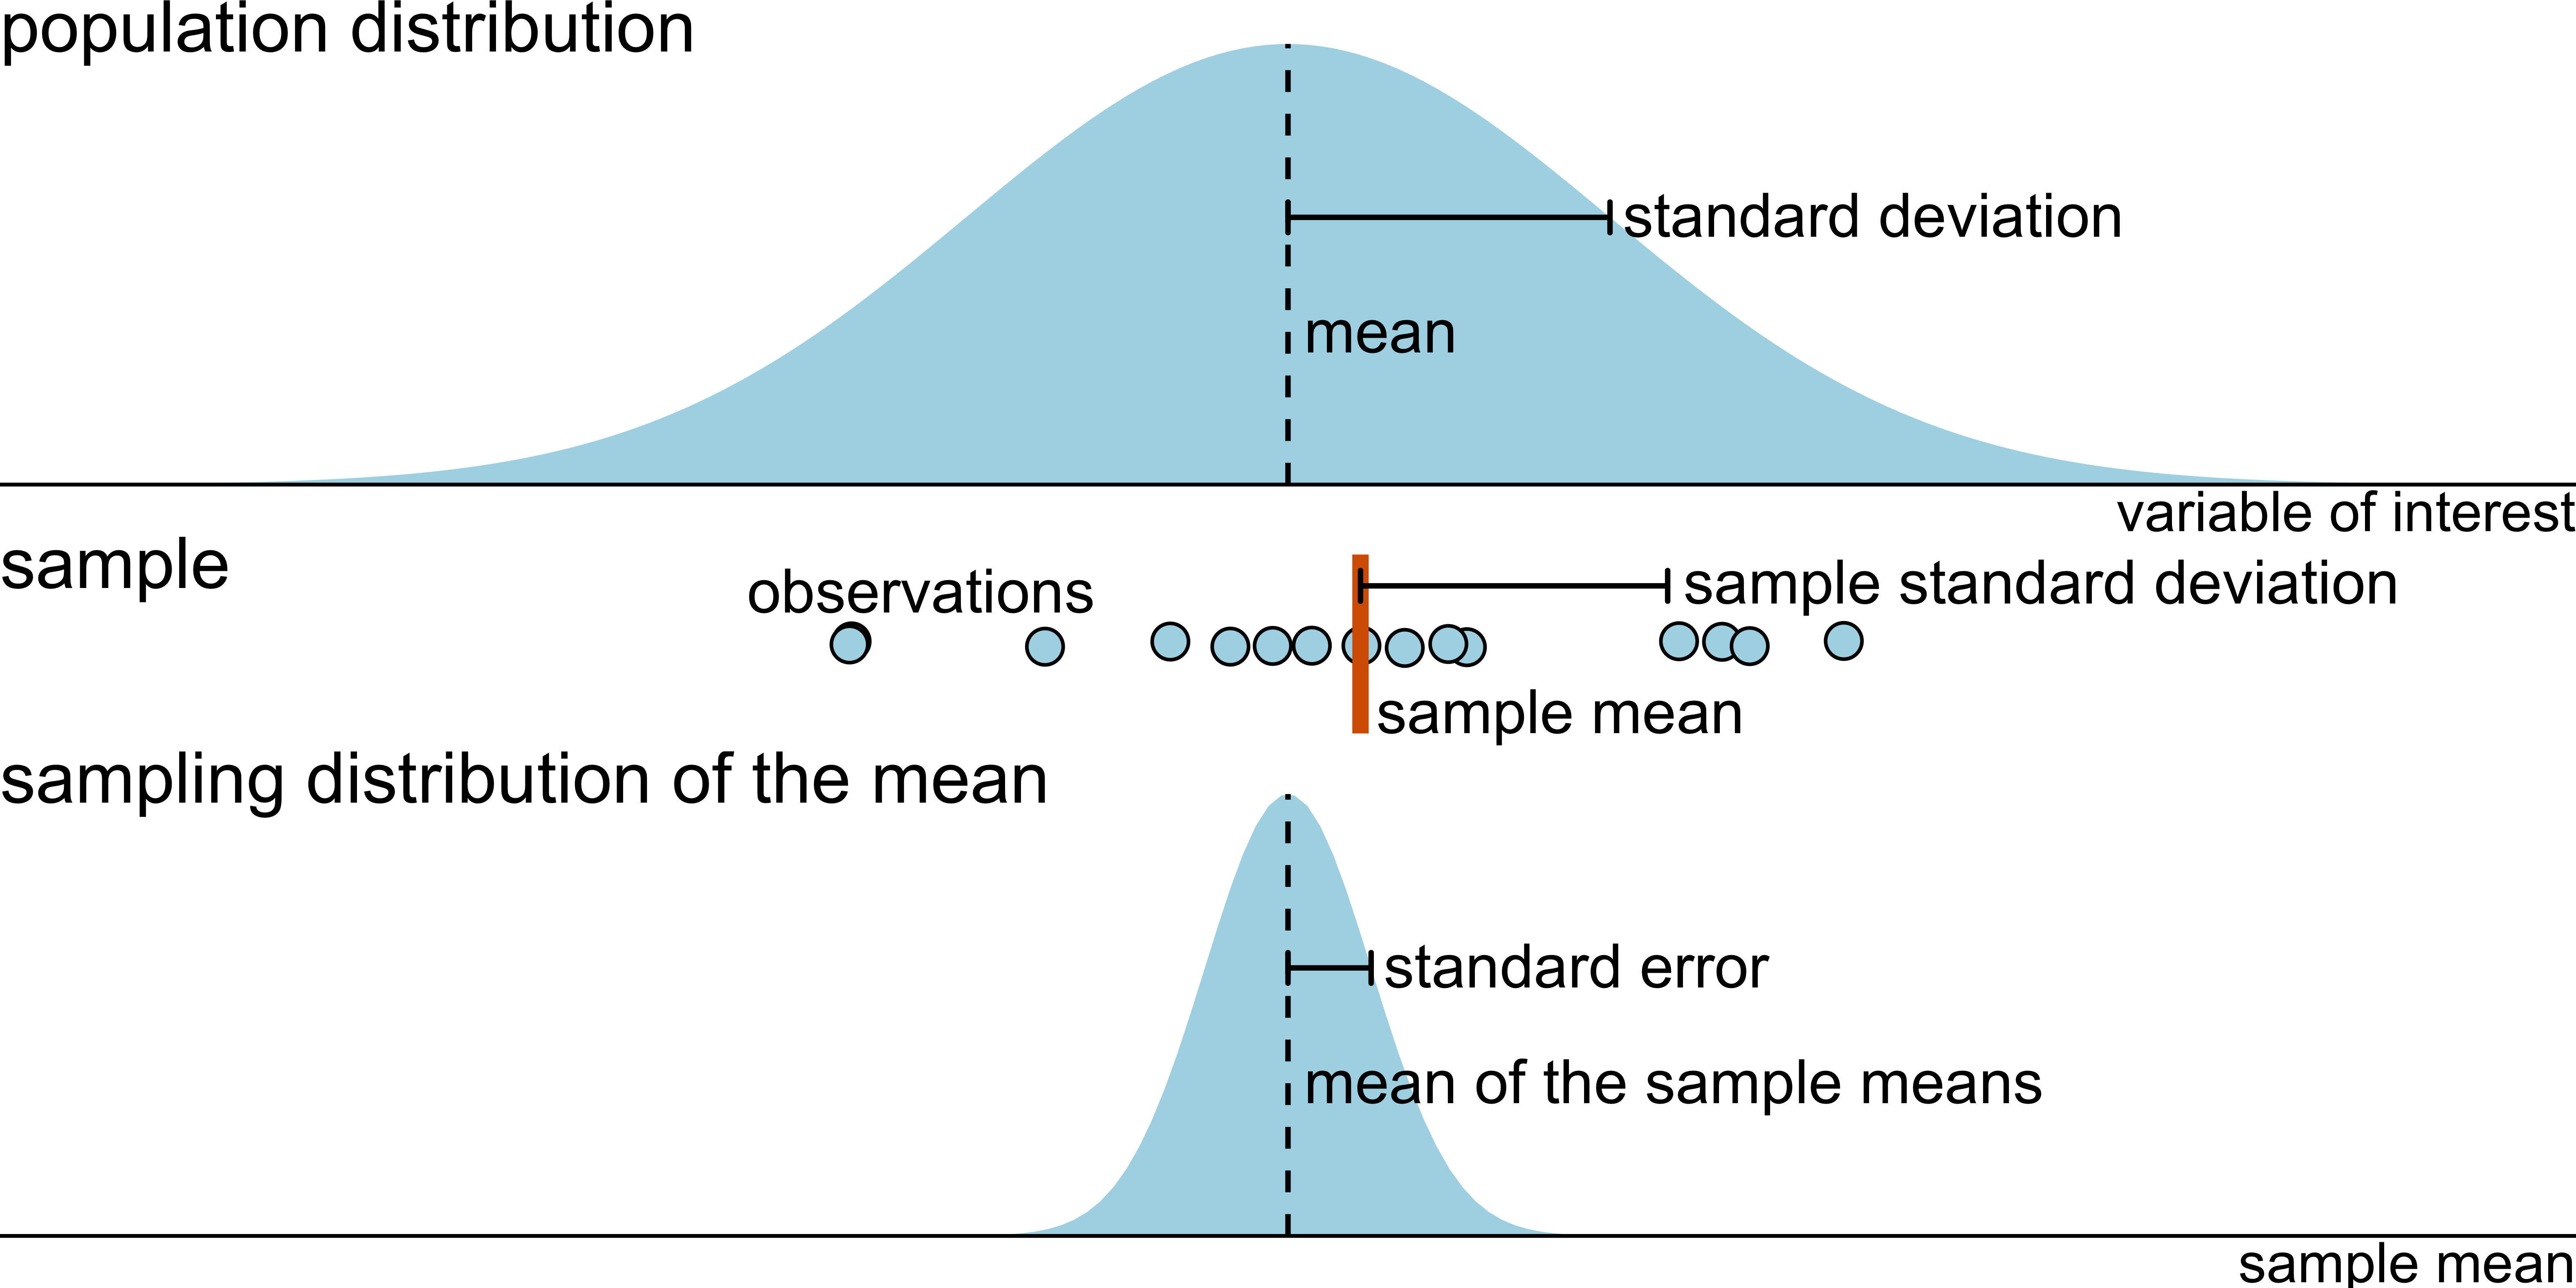
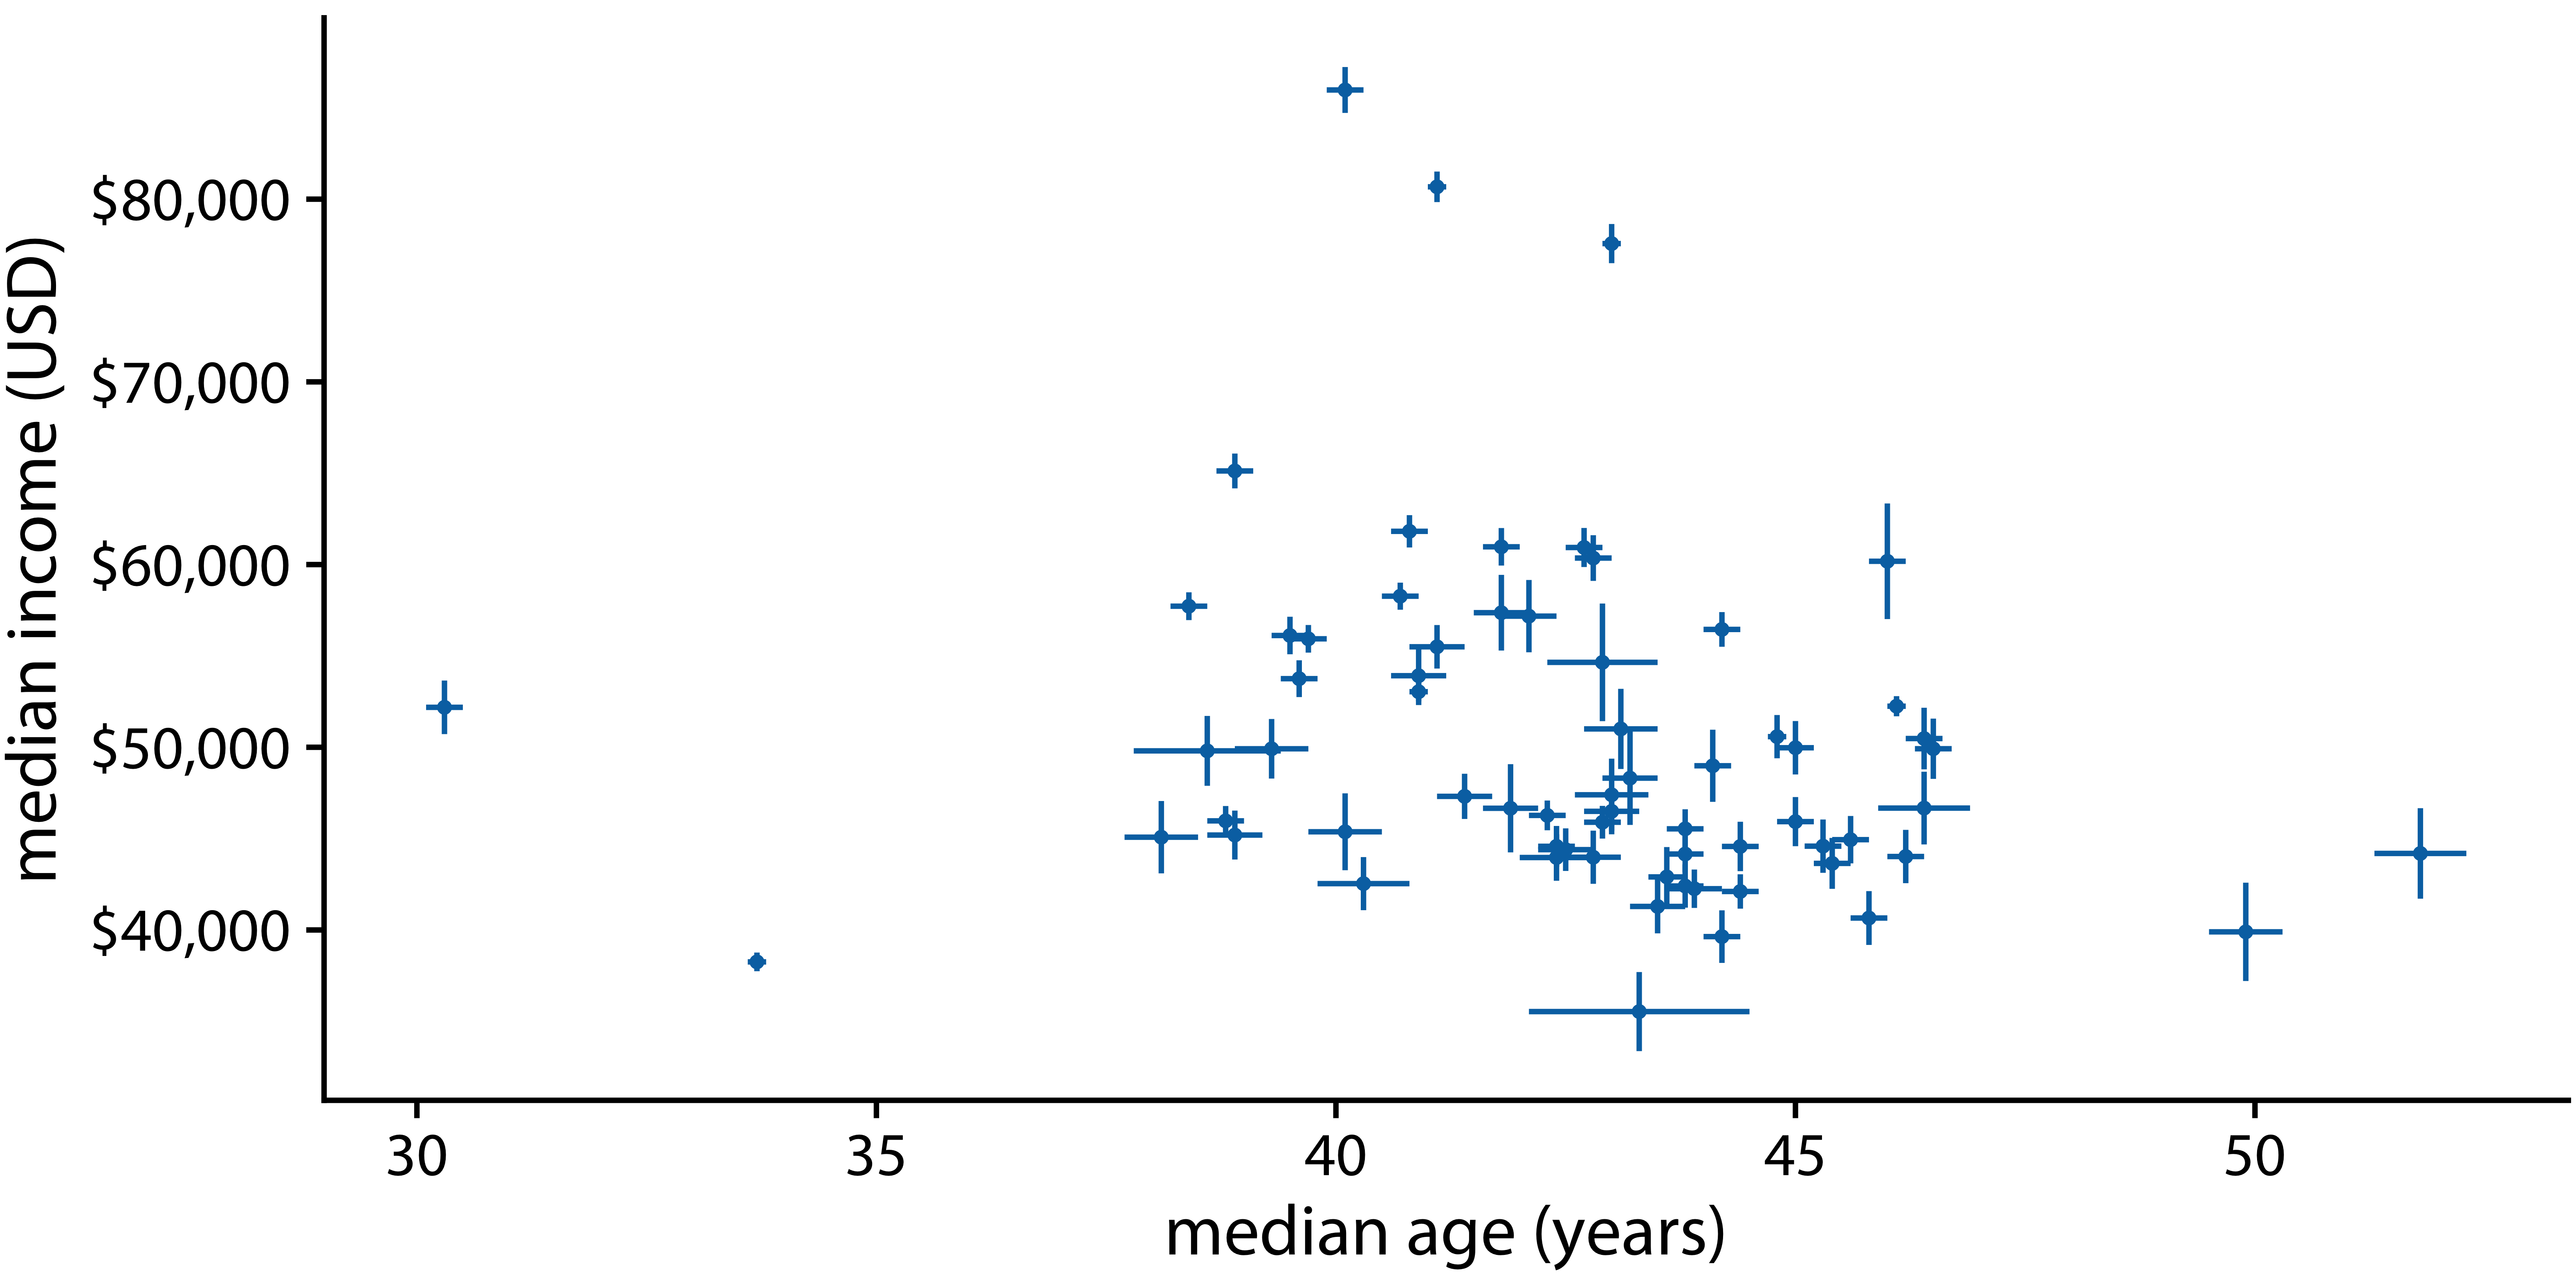
Uncertainty of point estimates
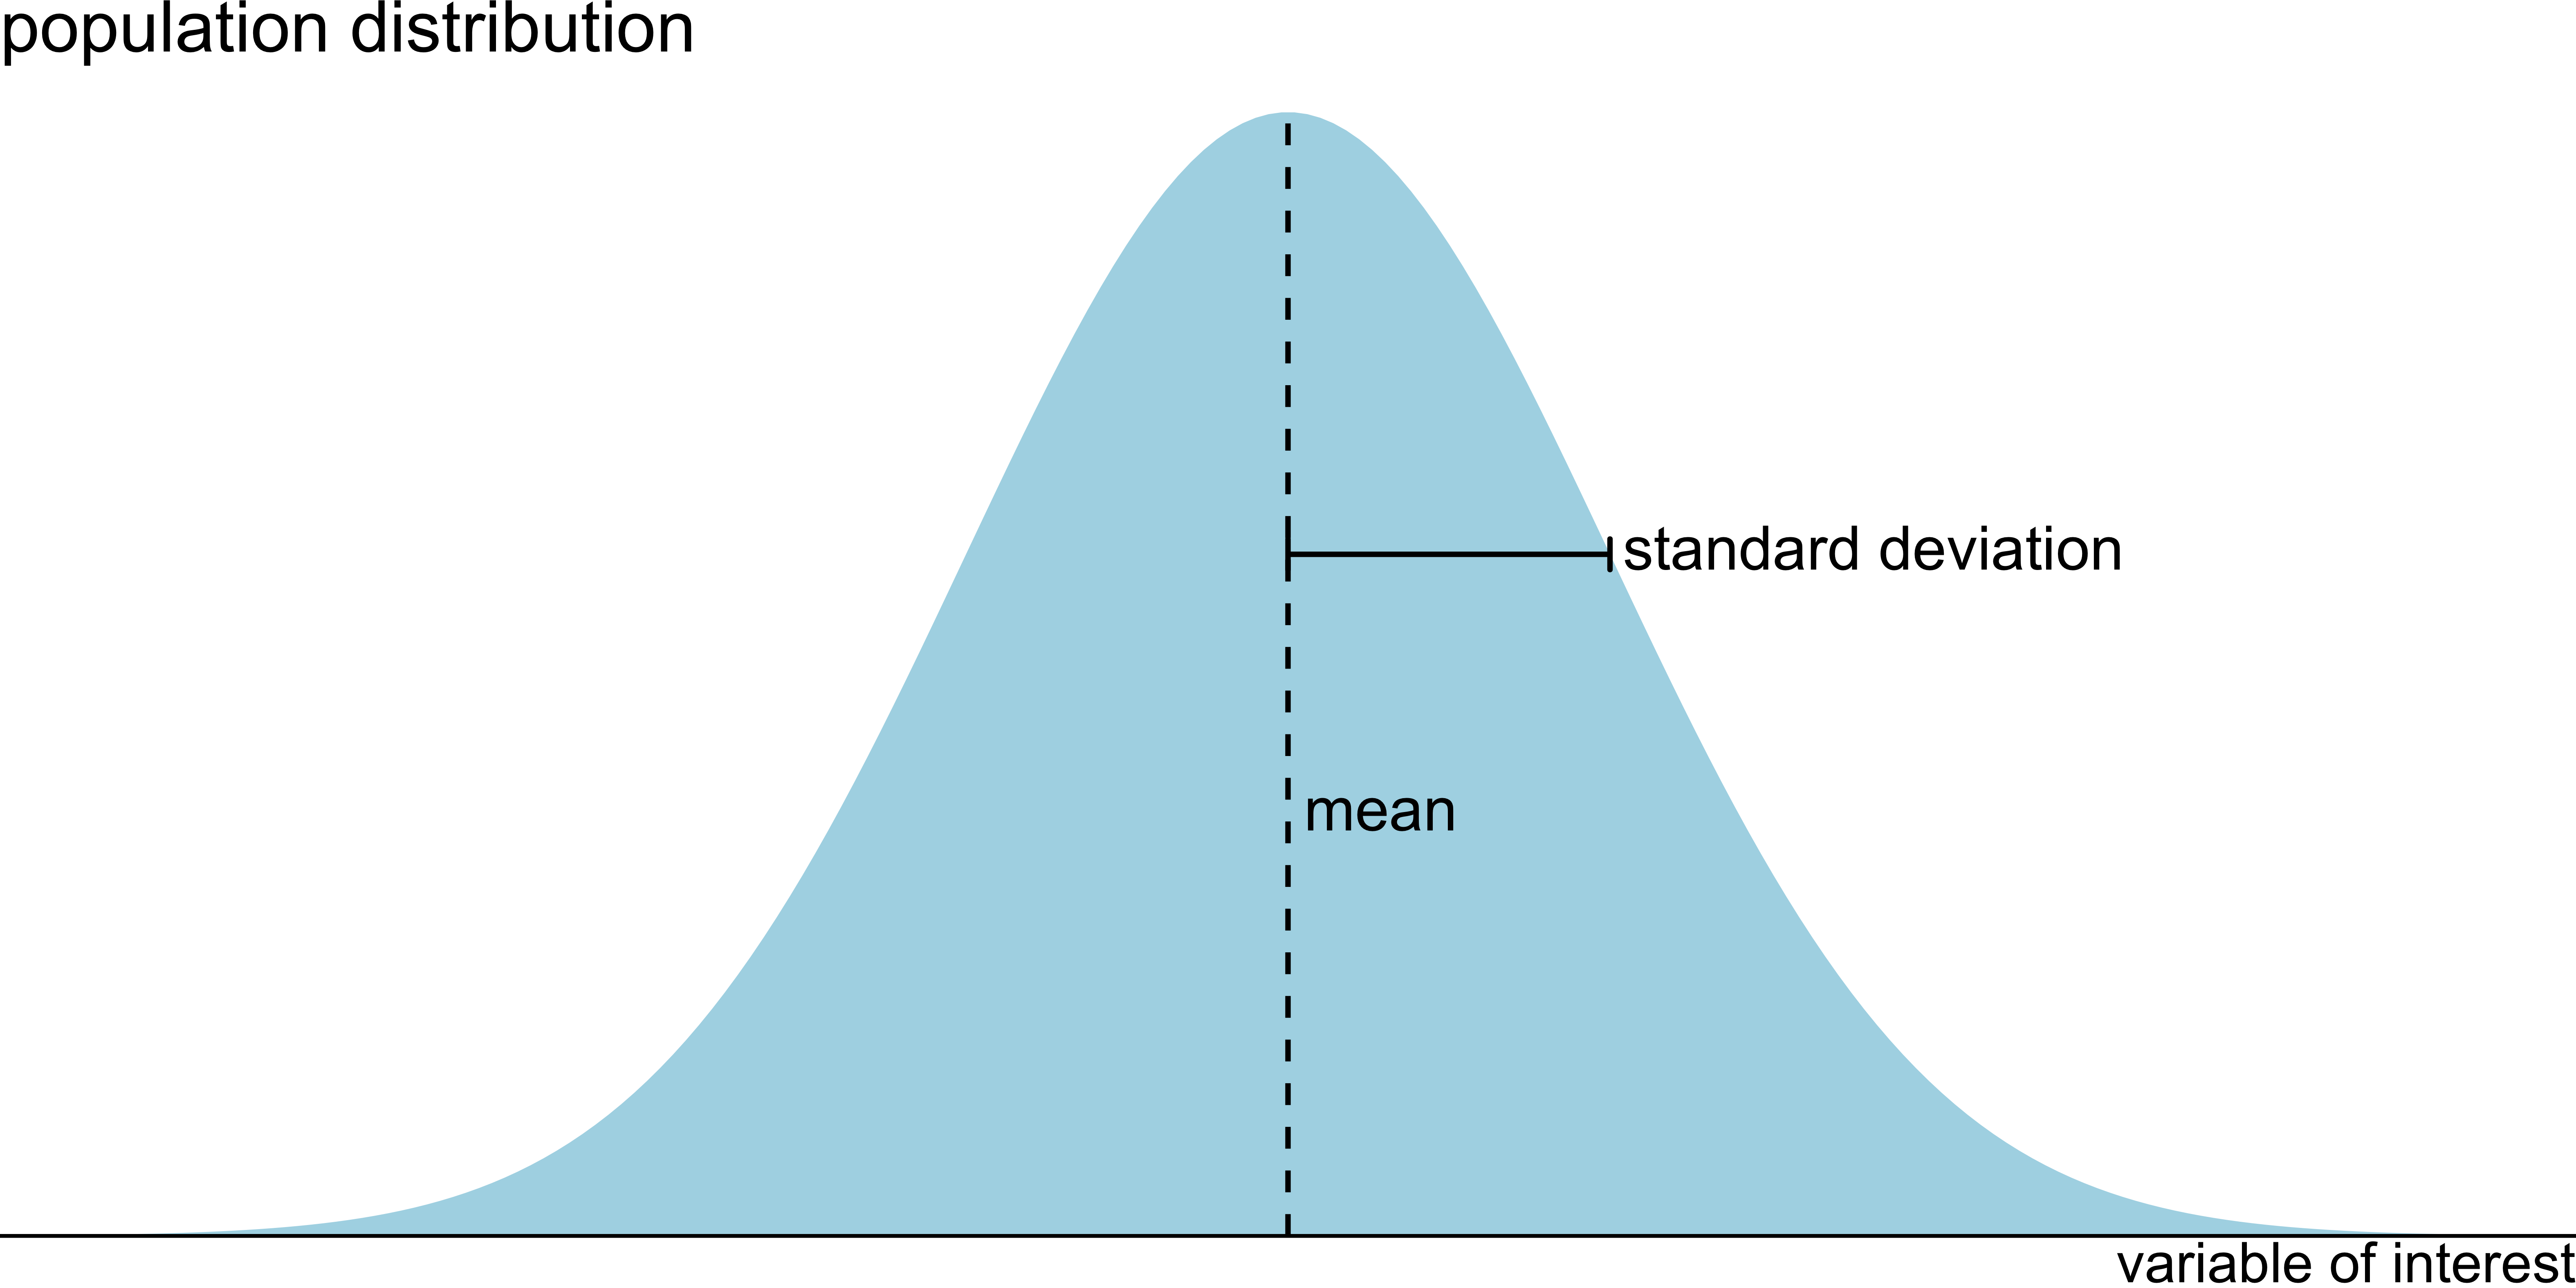
Uncertainty of point estimates
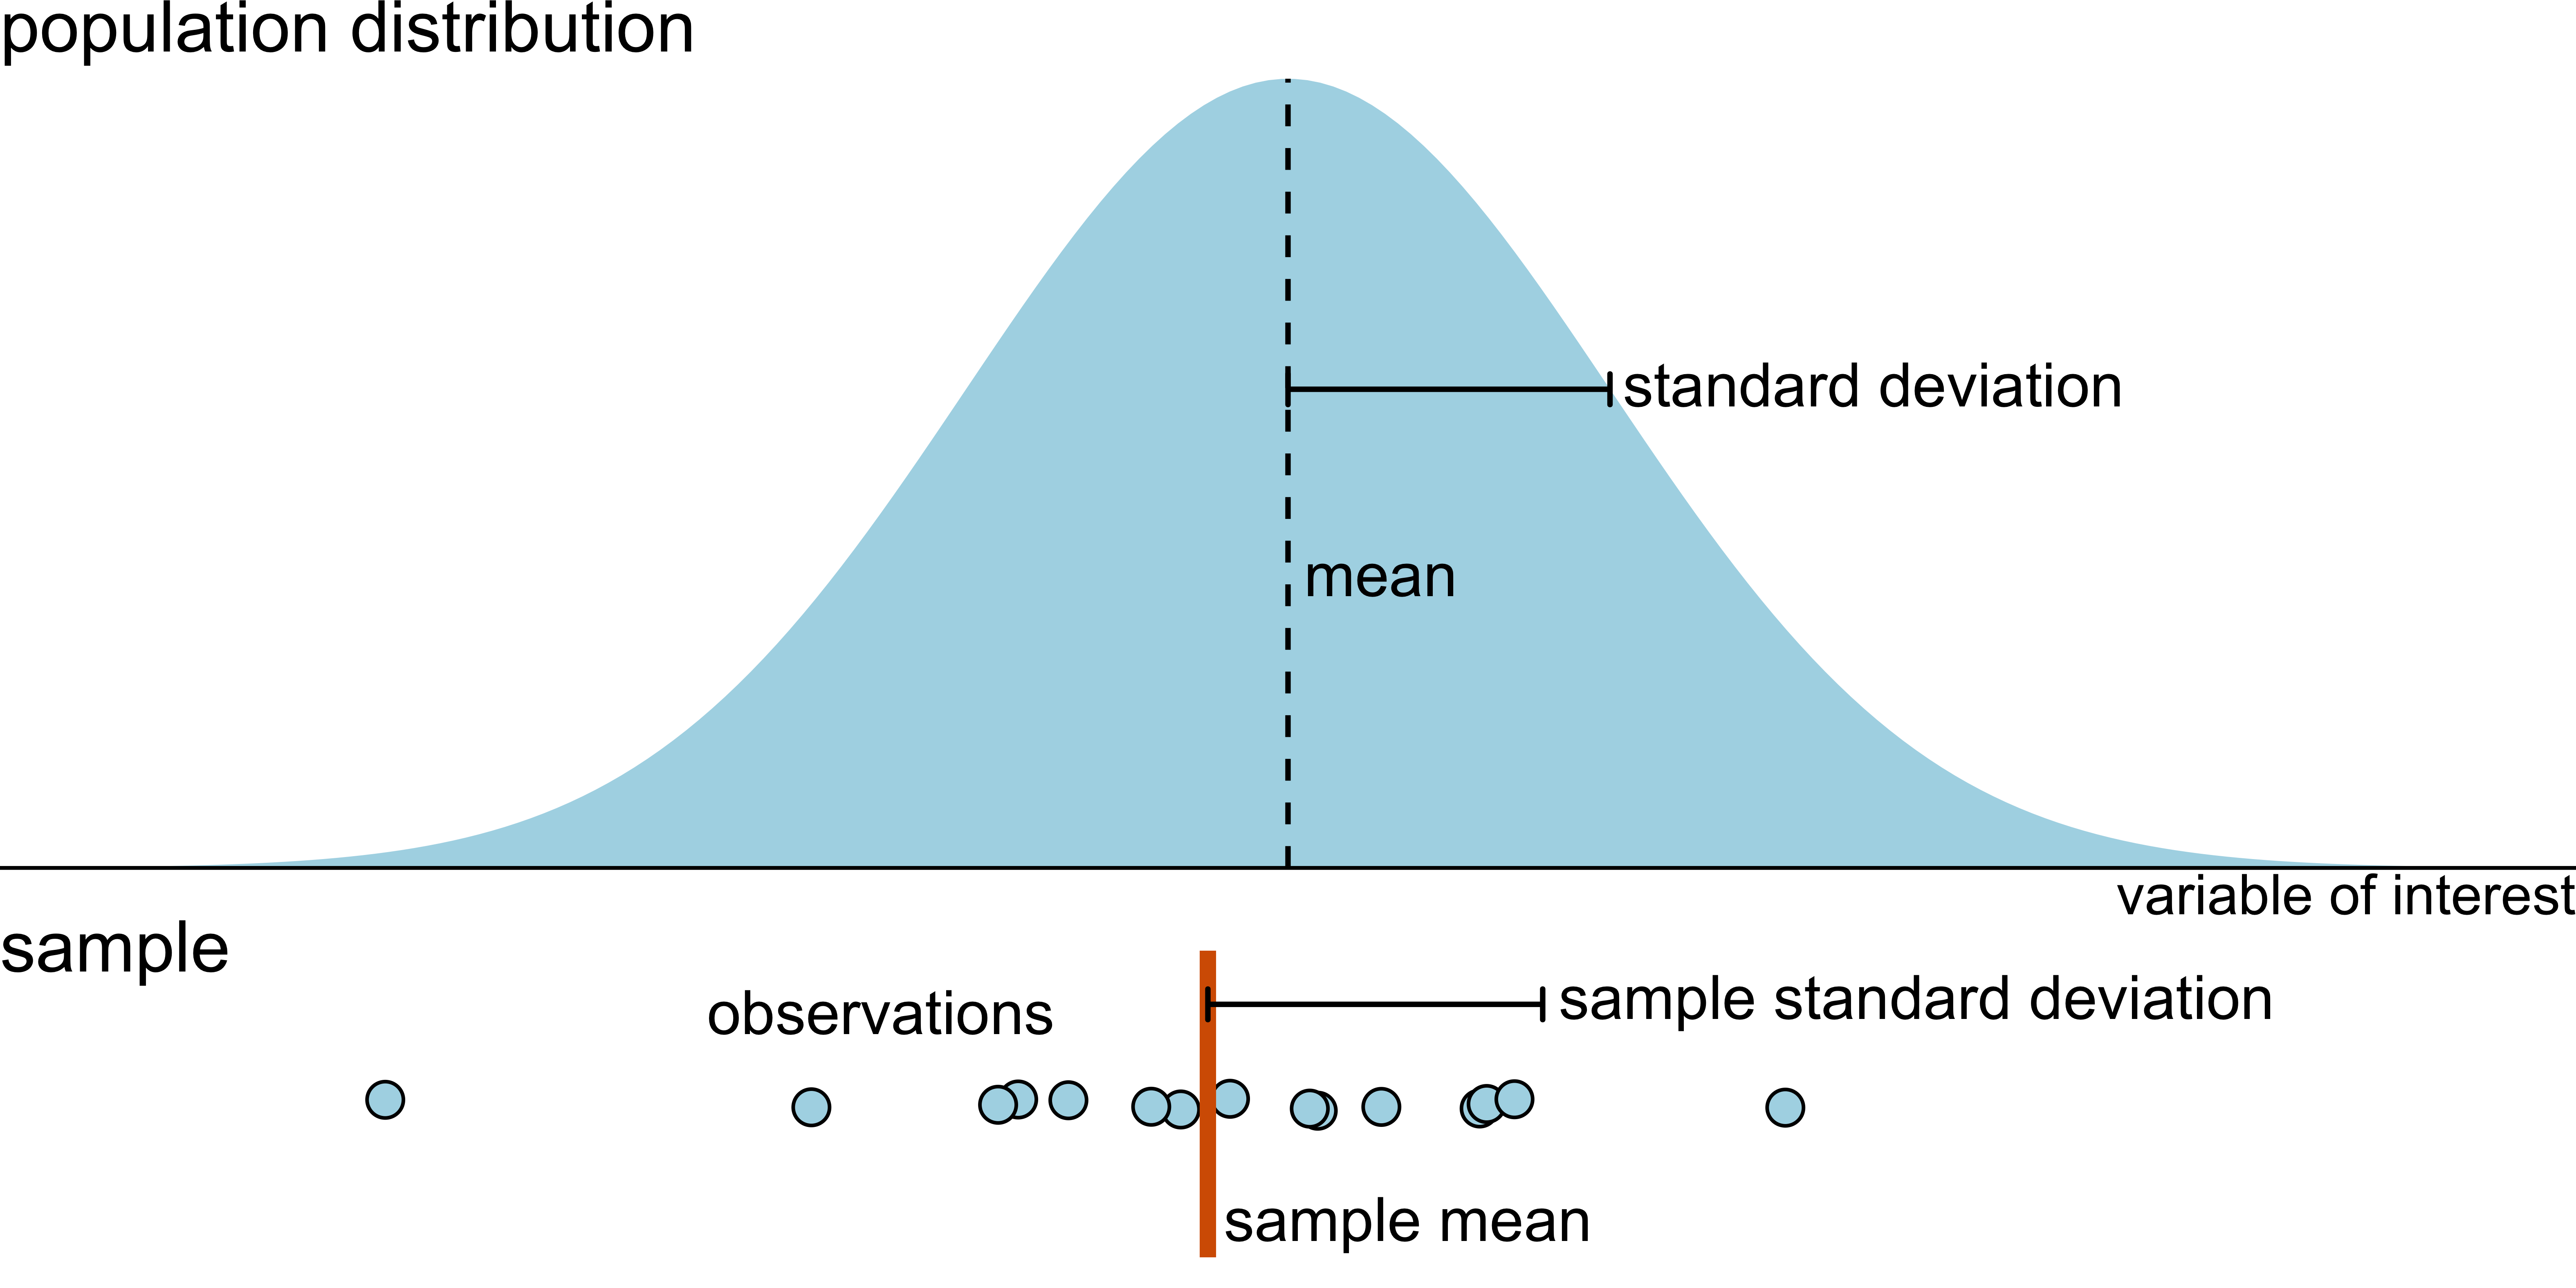
Uncertainty of point estimates
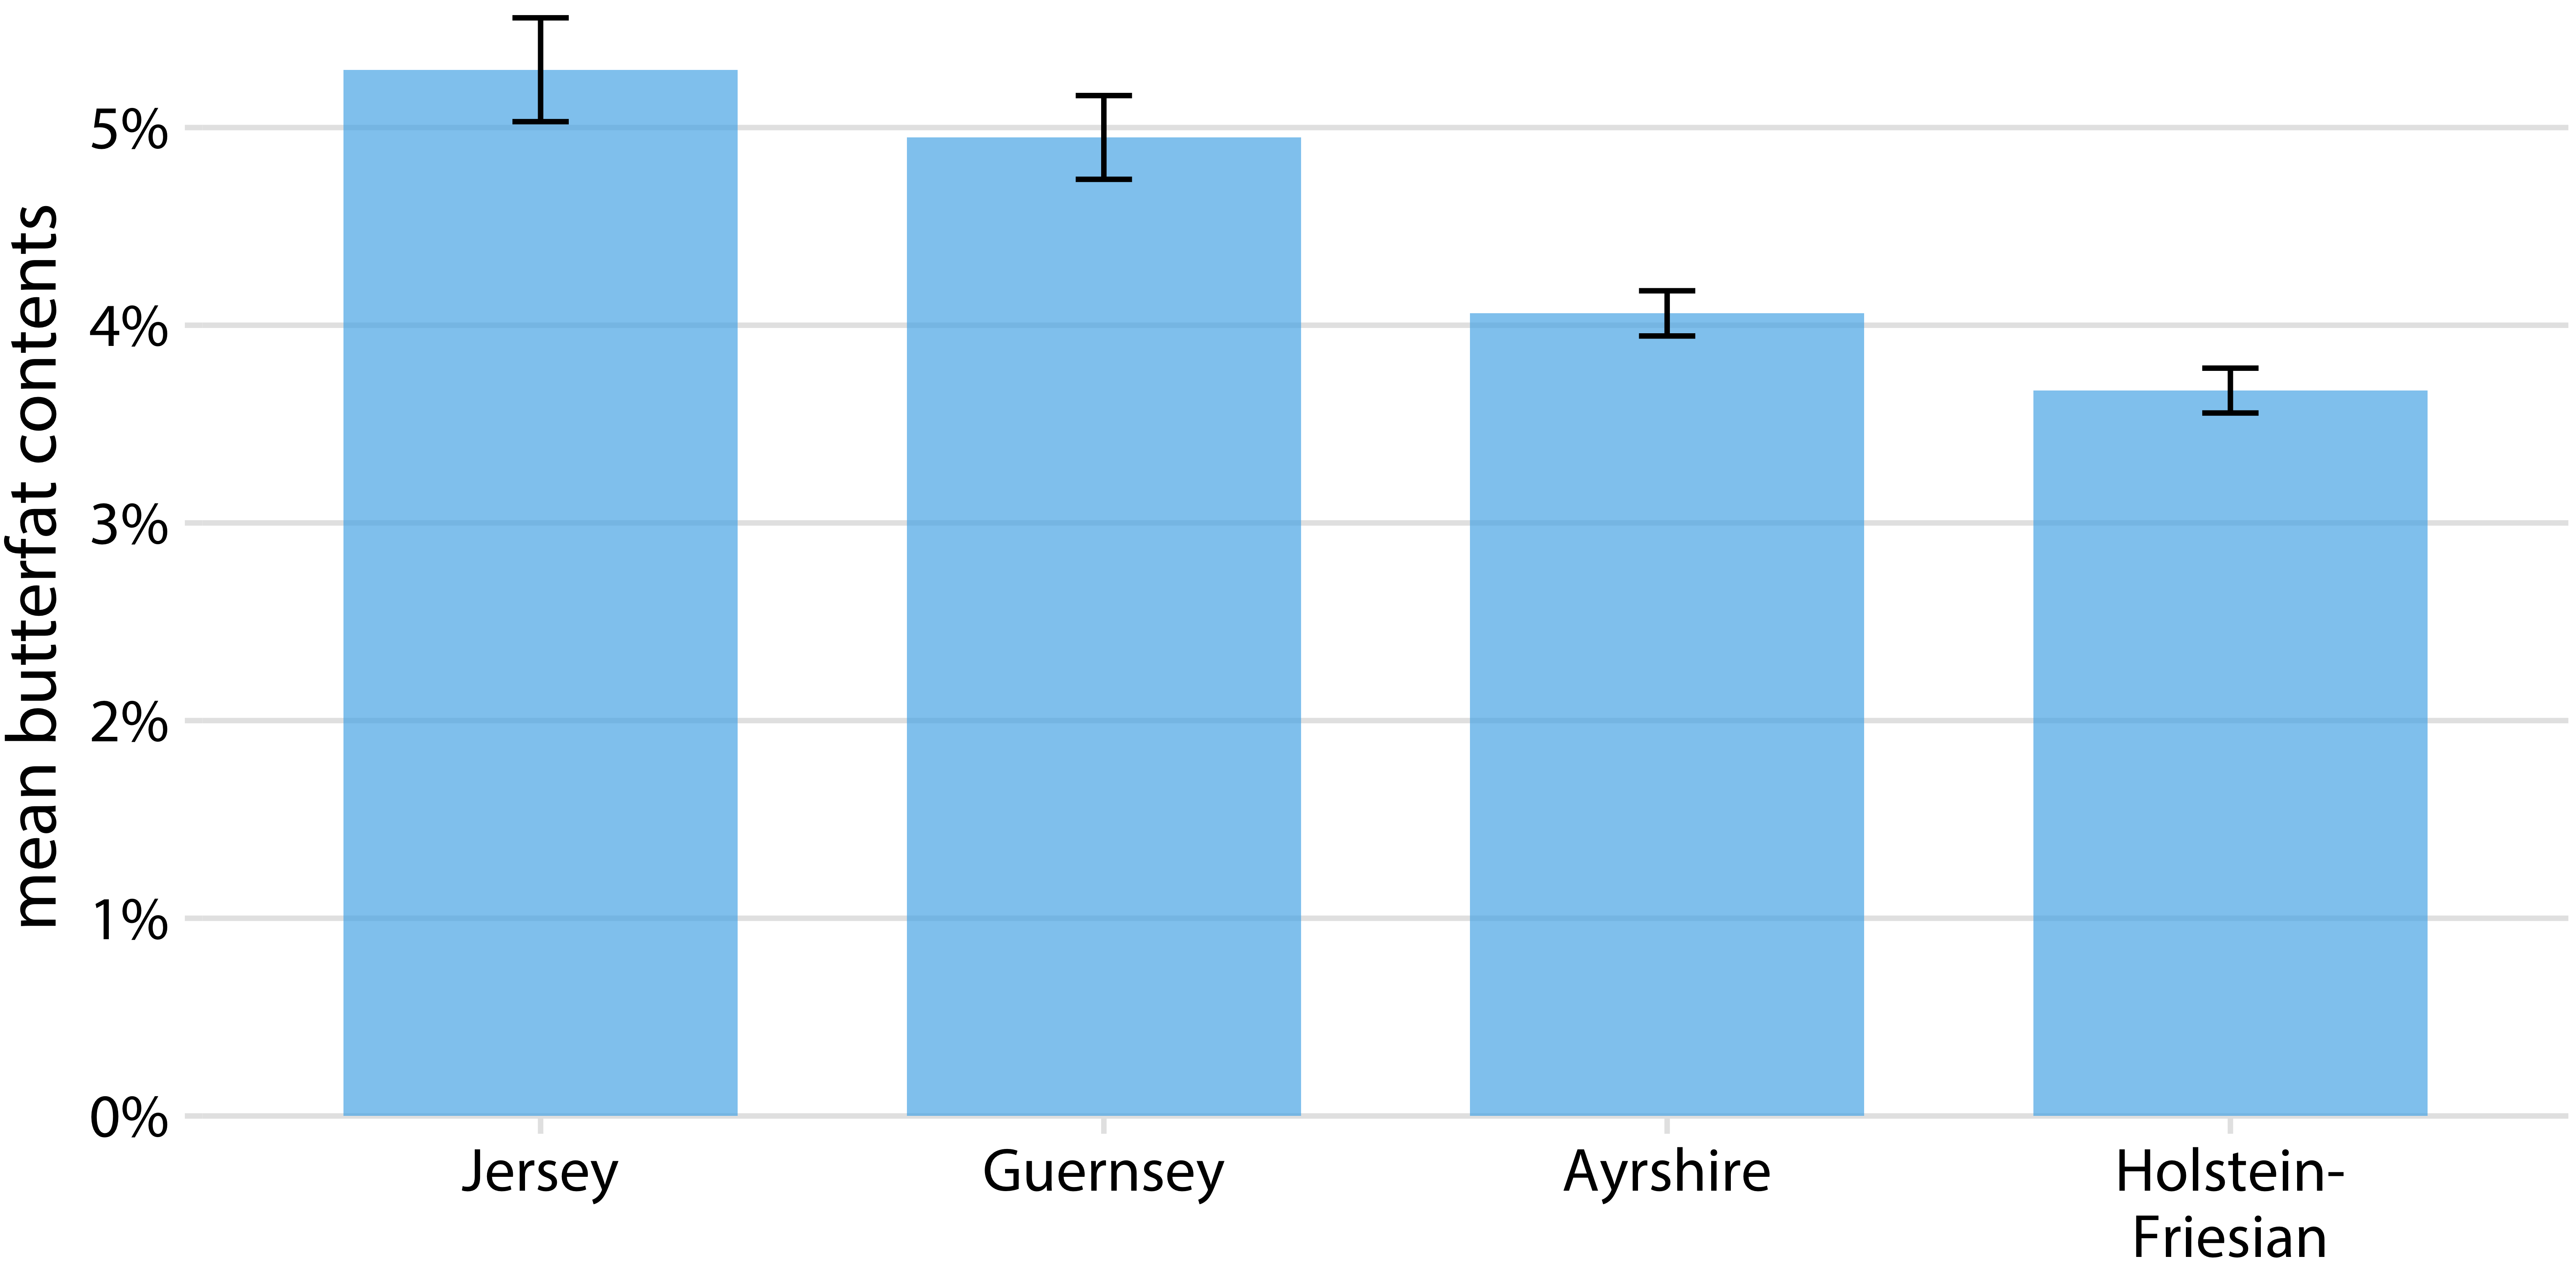
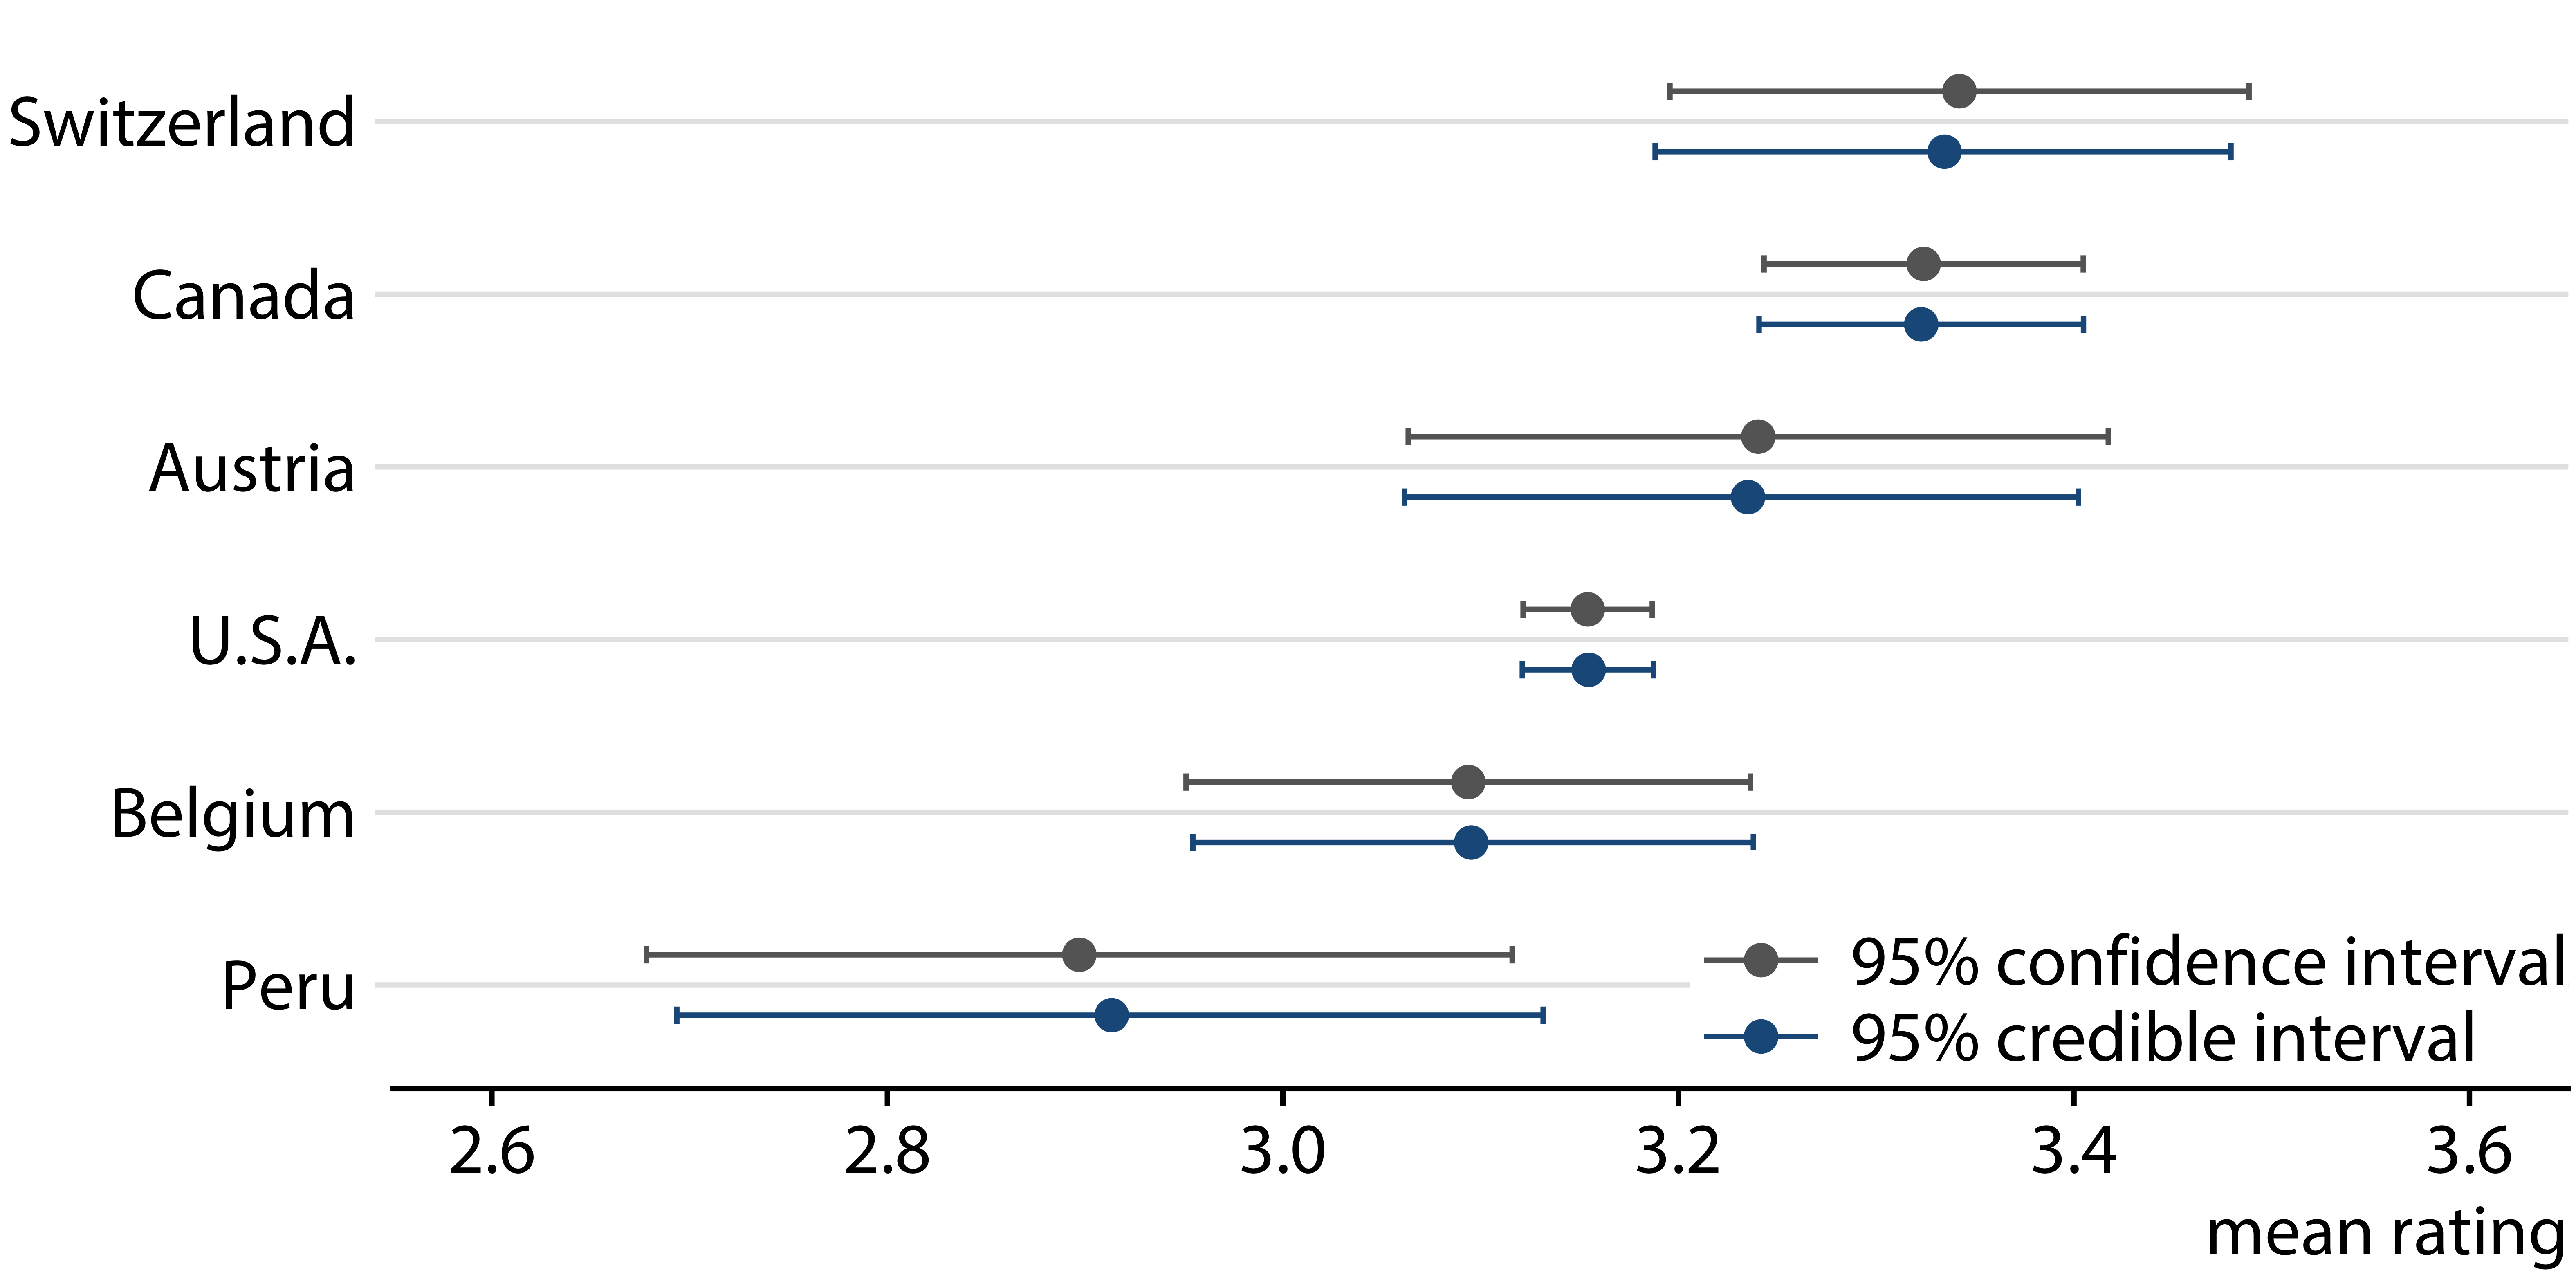
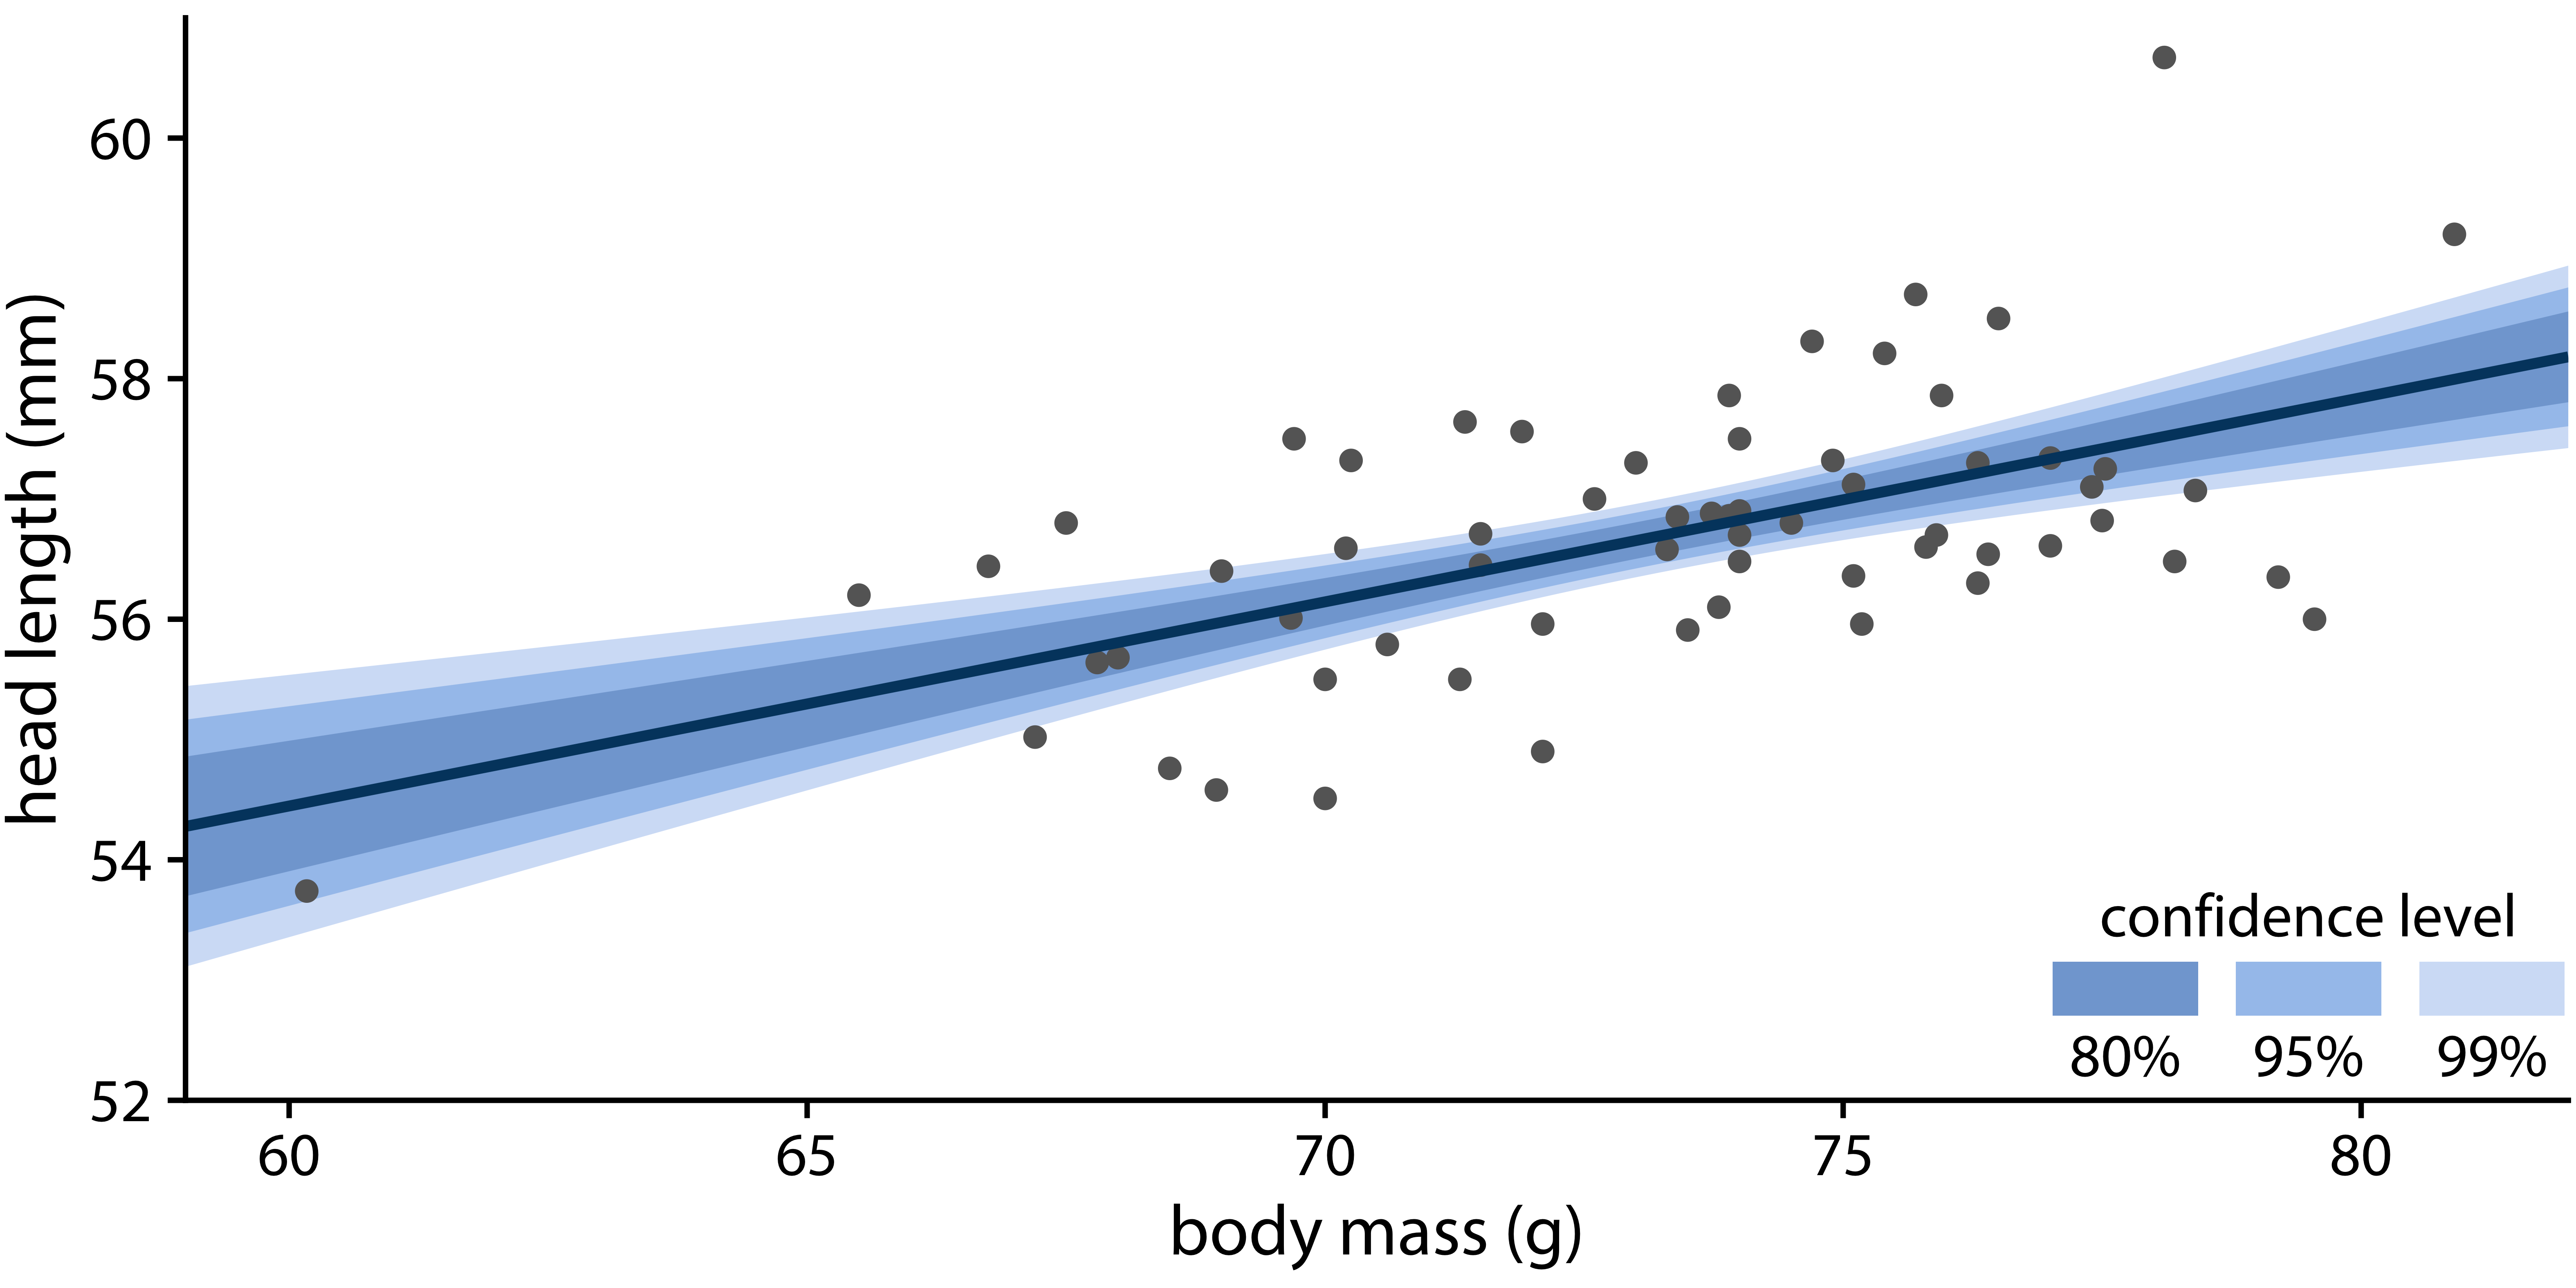
Error bars
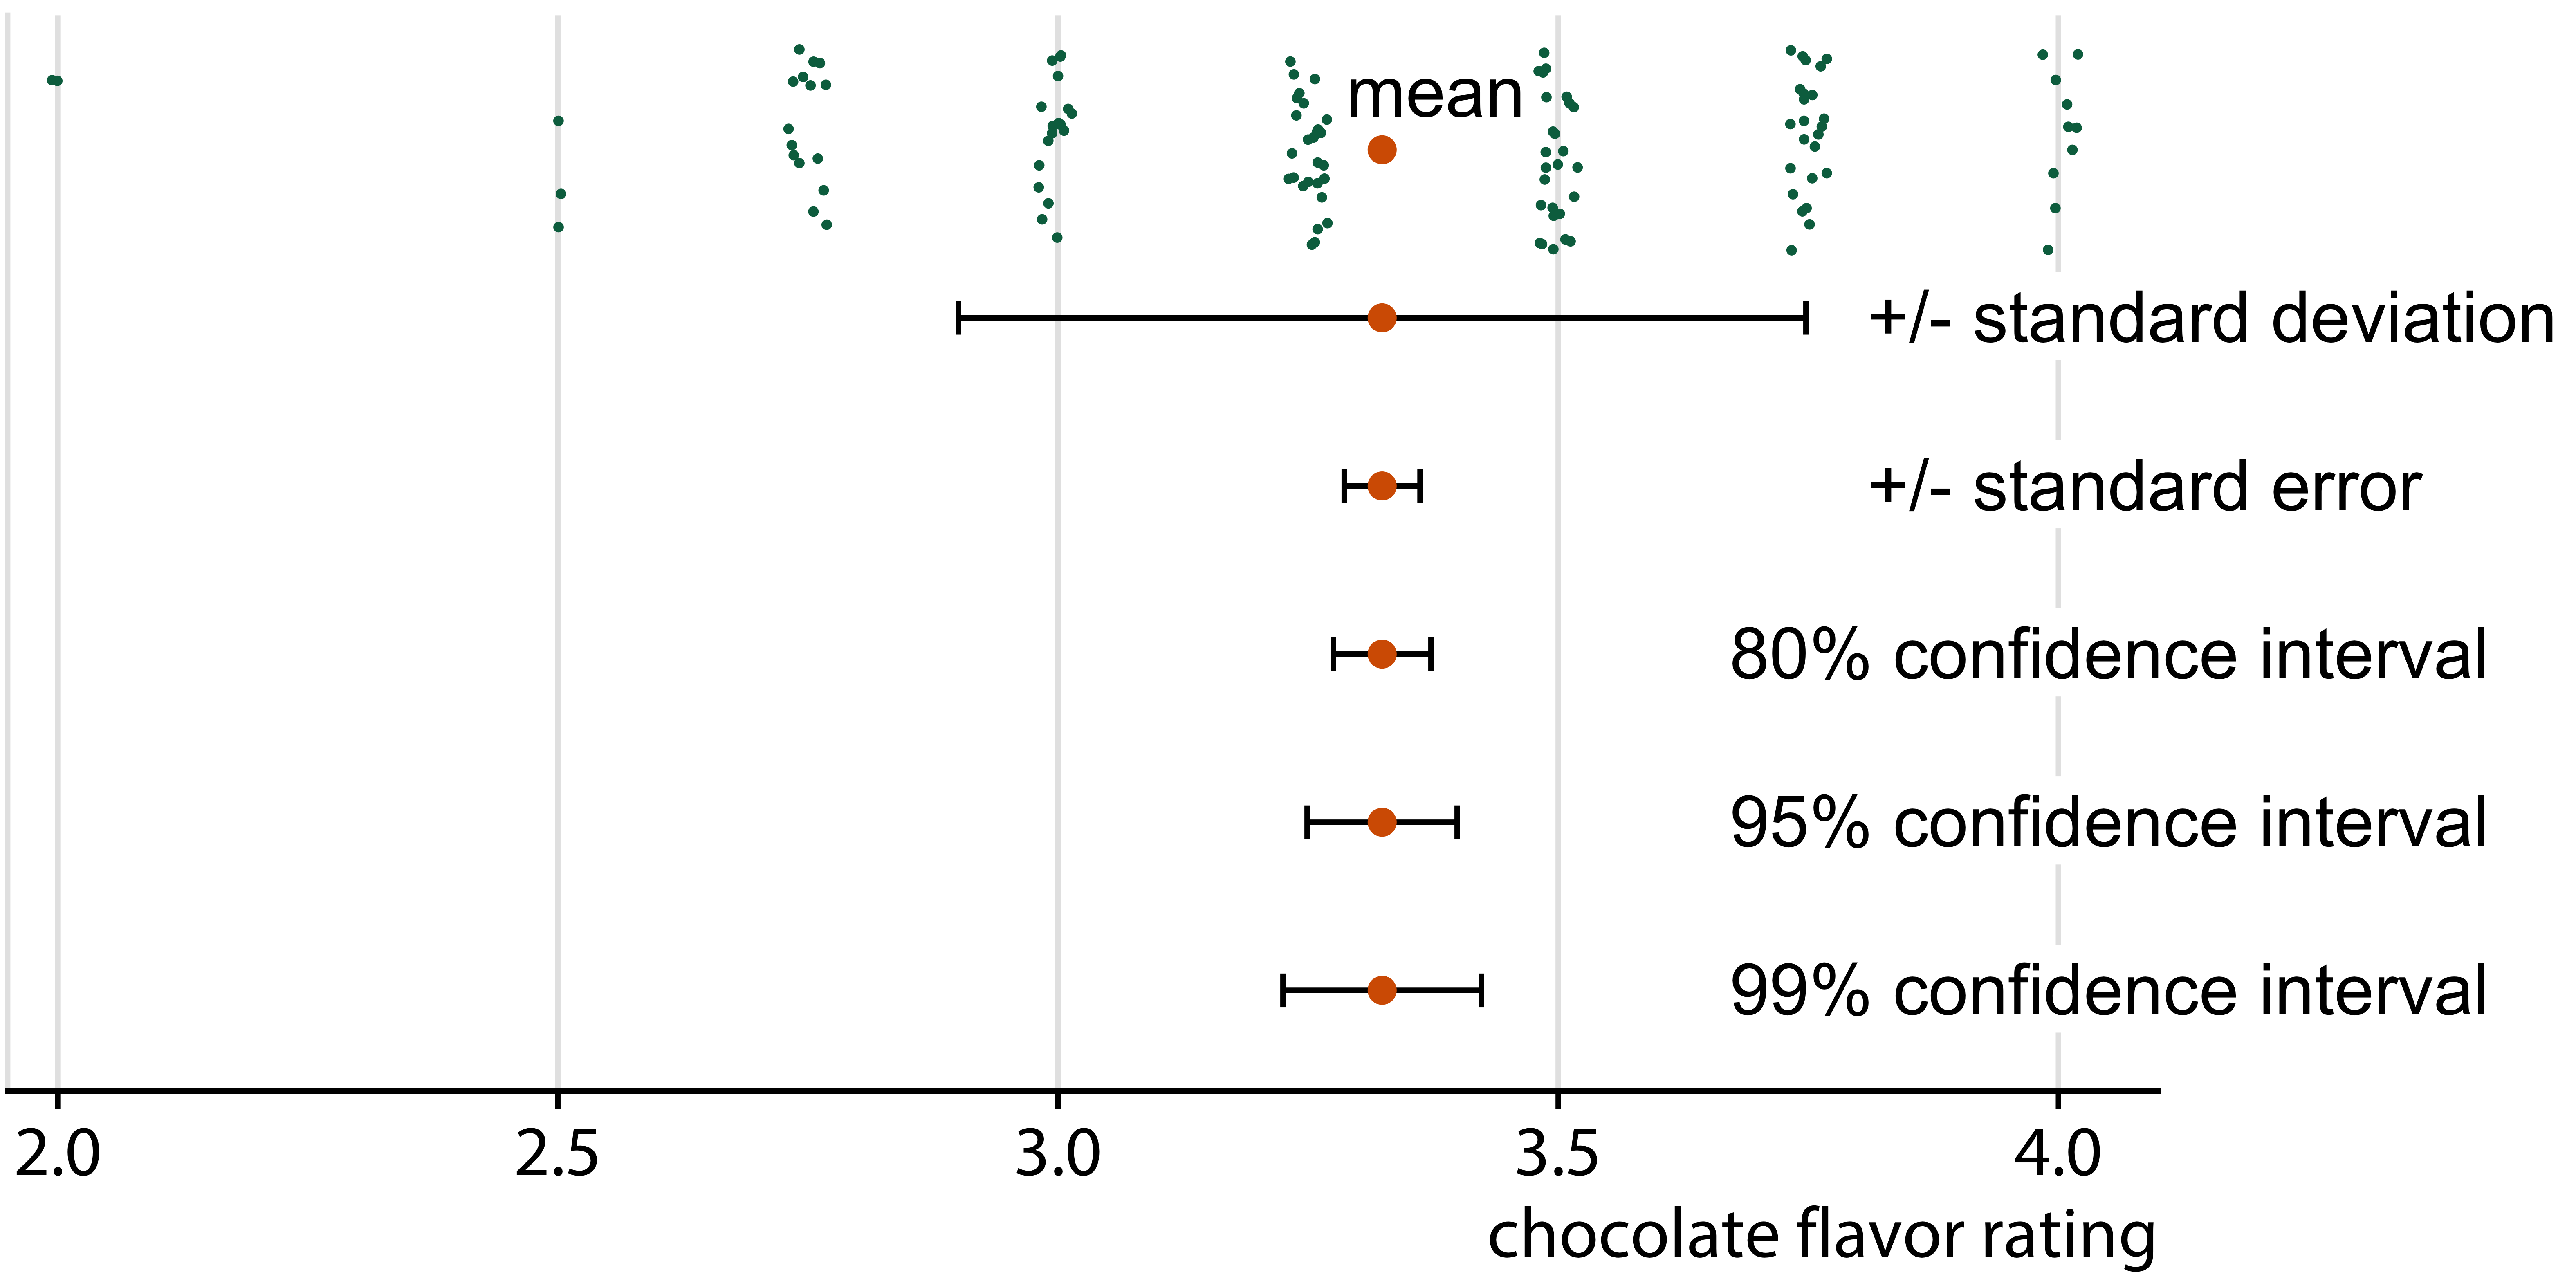
Whenever you visualize uncertainty with error bars, you must specify what quantity and/or confidence level the error bars represent.
Sample size and standard error
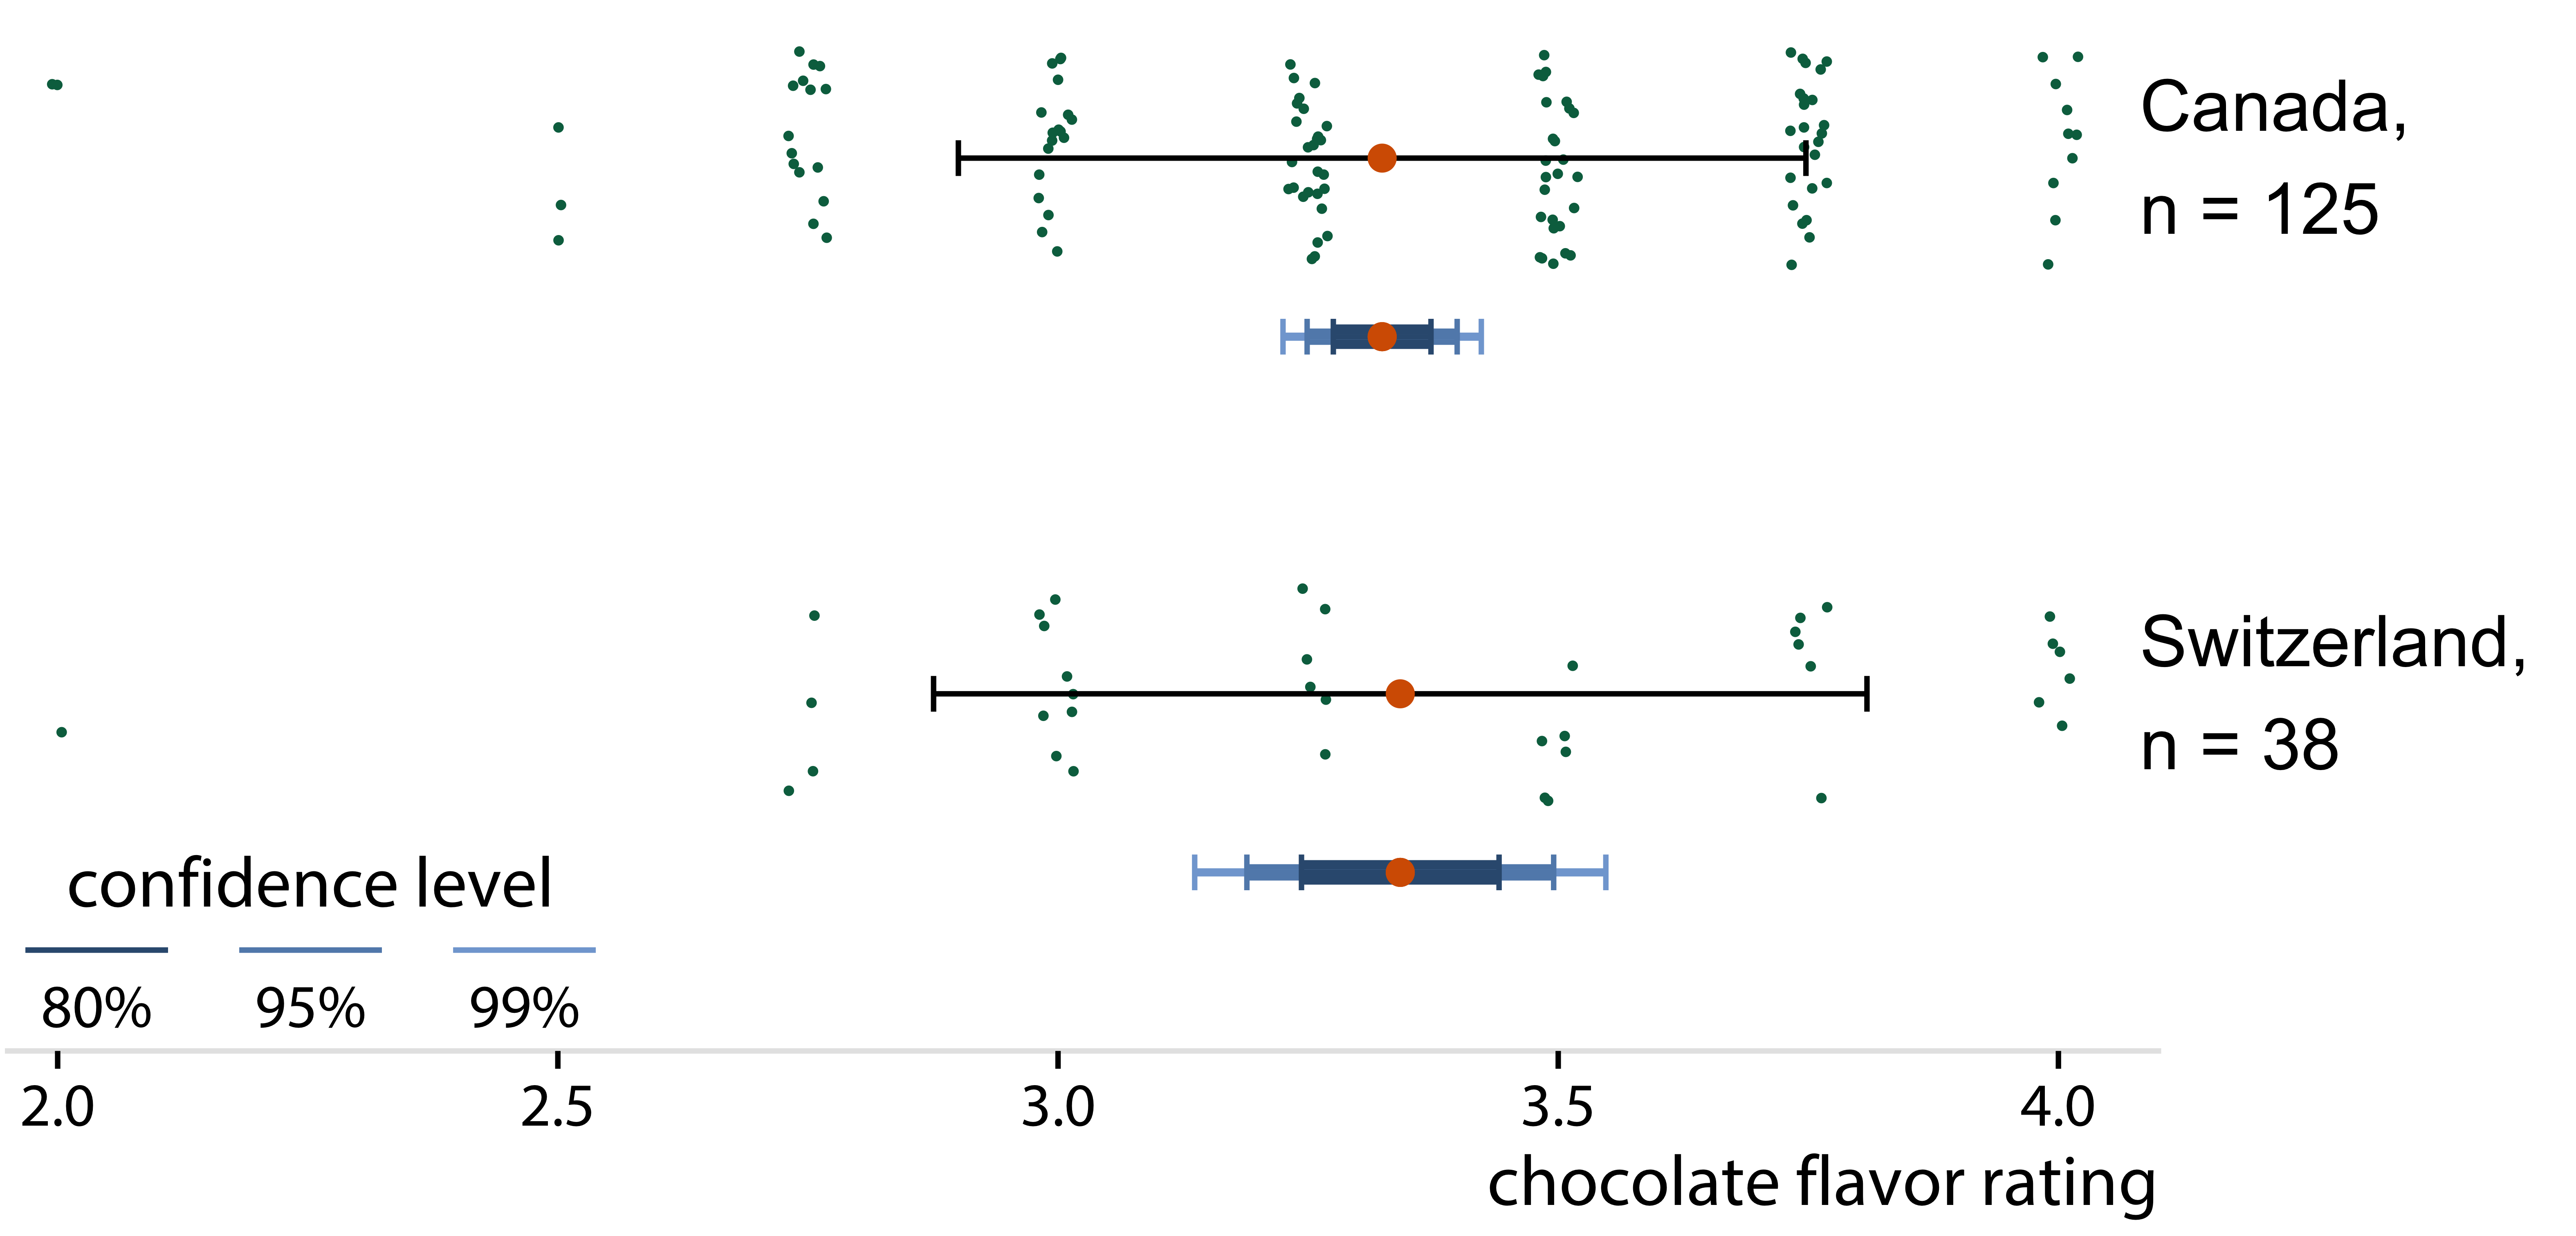
Confidence intervals widen with smaller sample size.
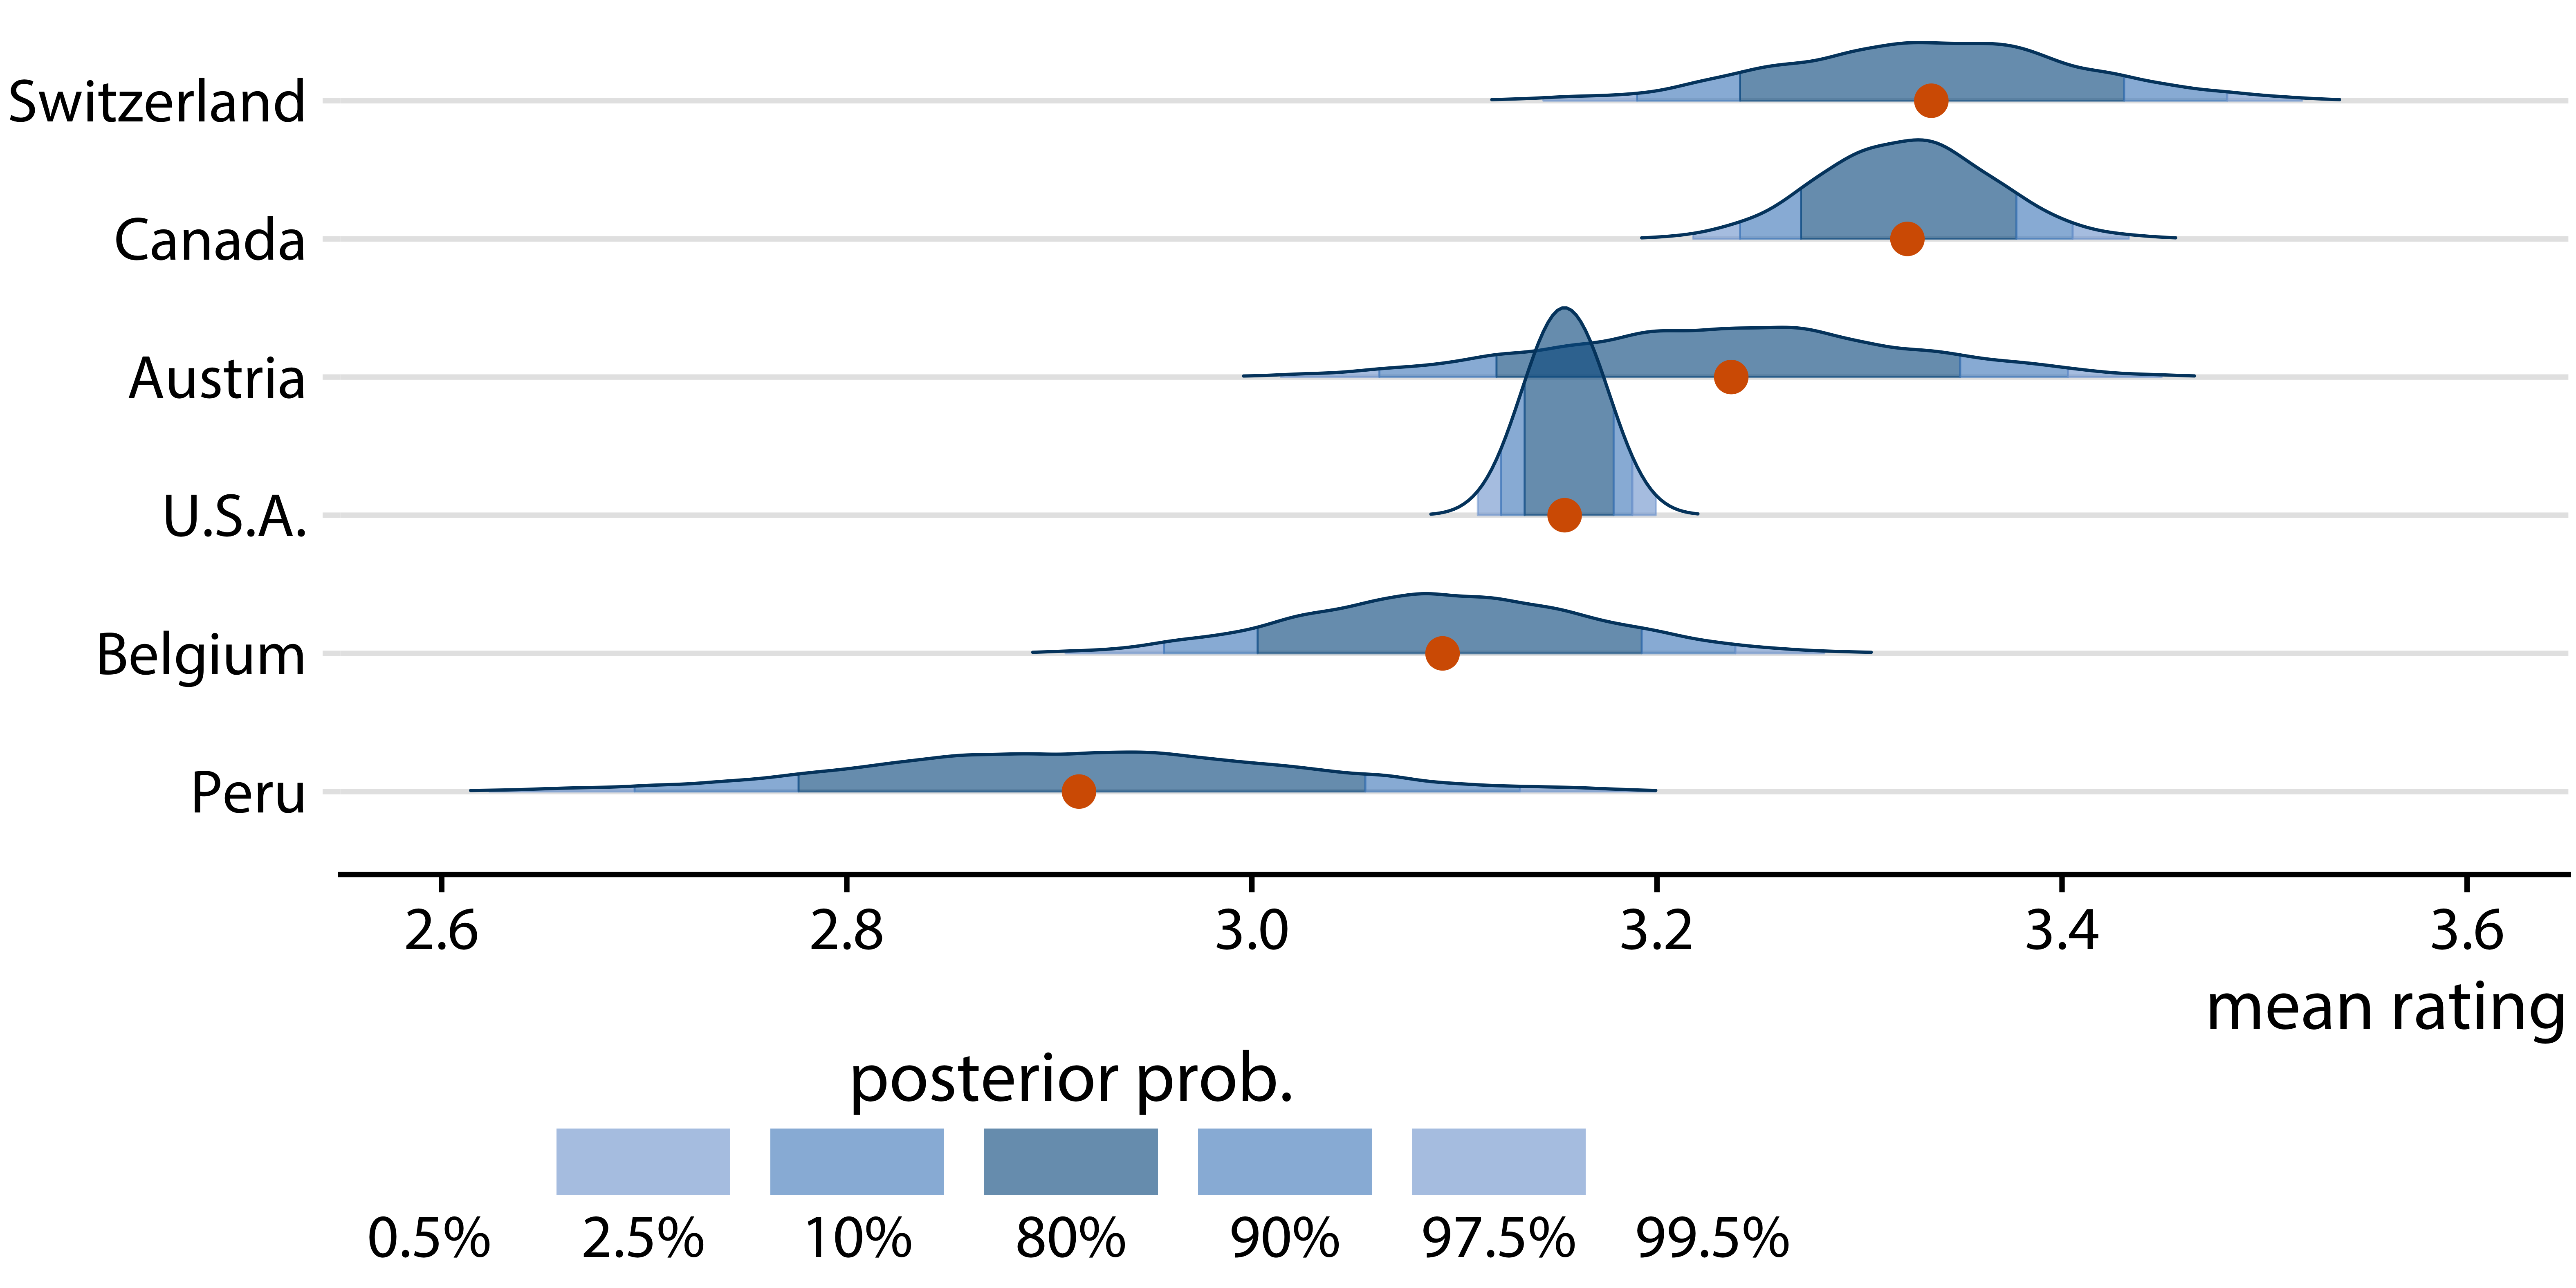
Mean chocolate flavor rating
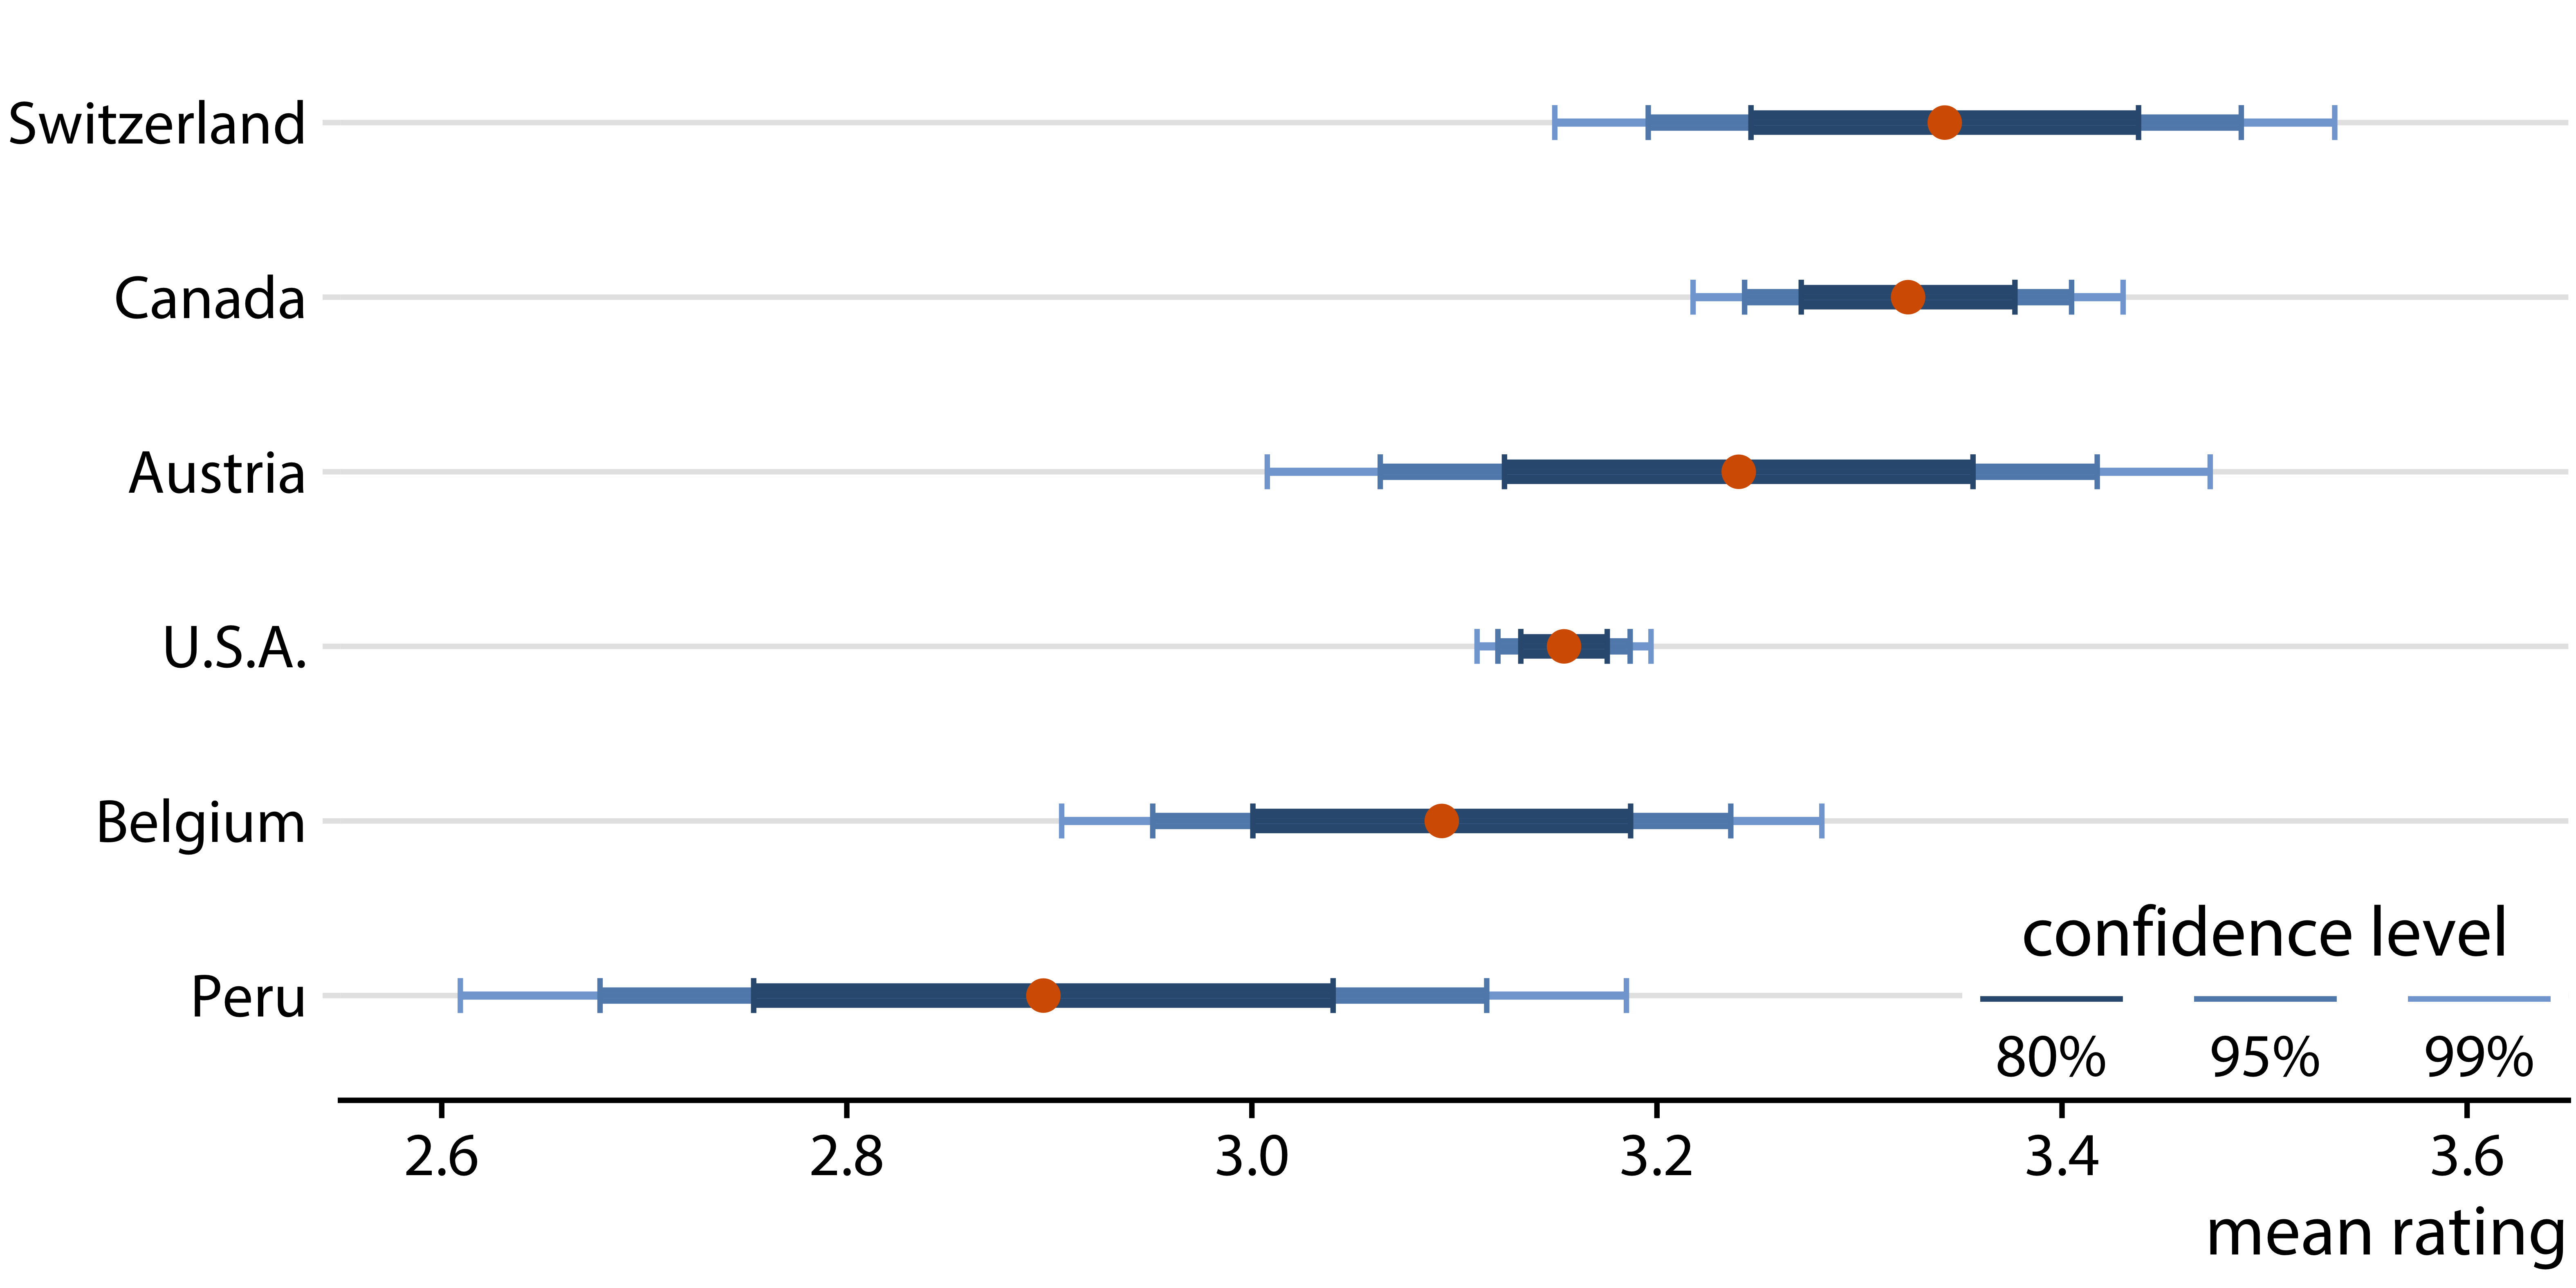
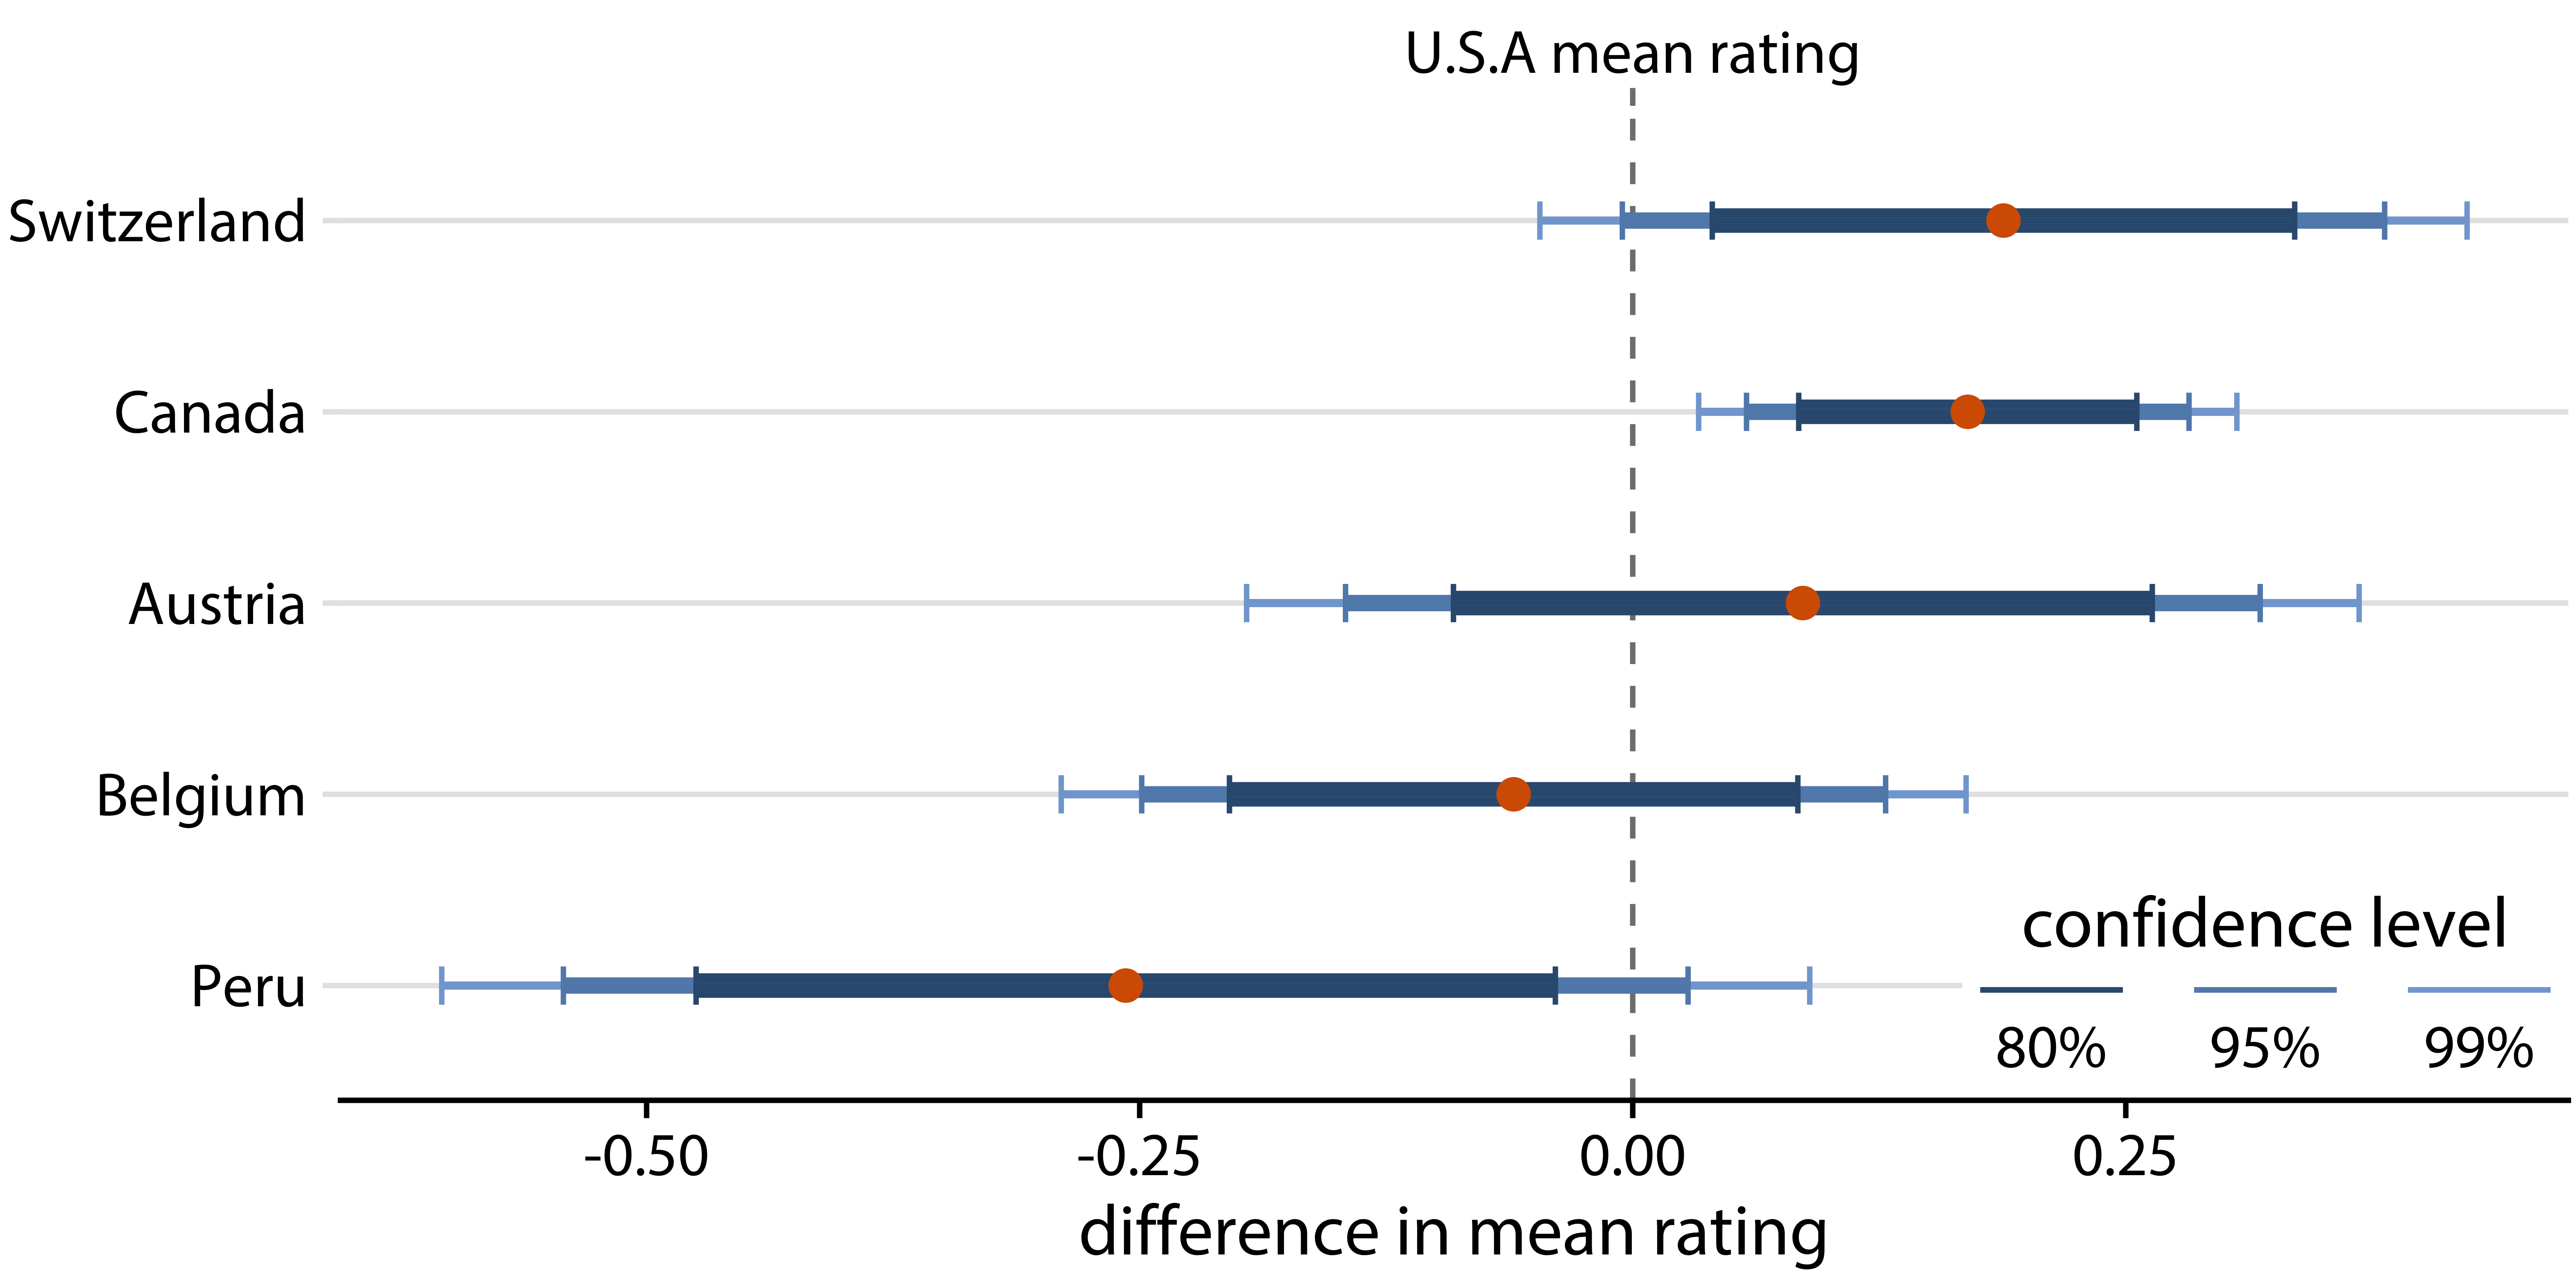
Approaches to visualizing uncertainty
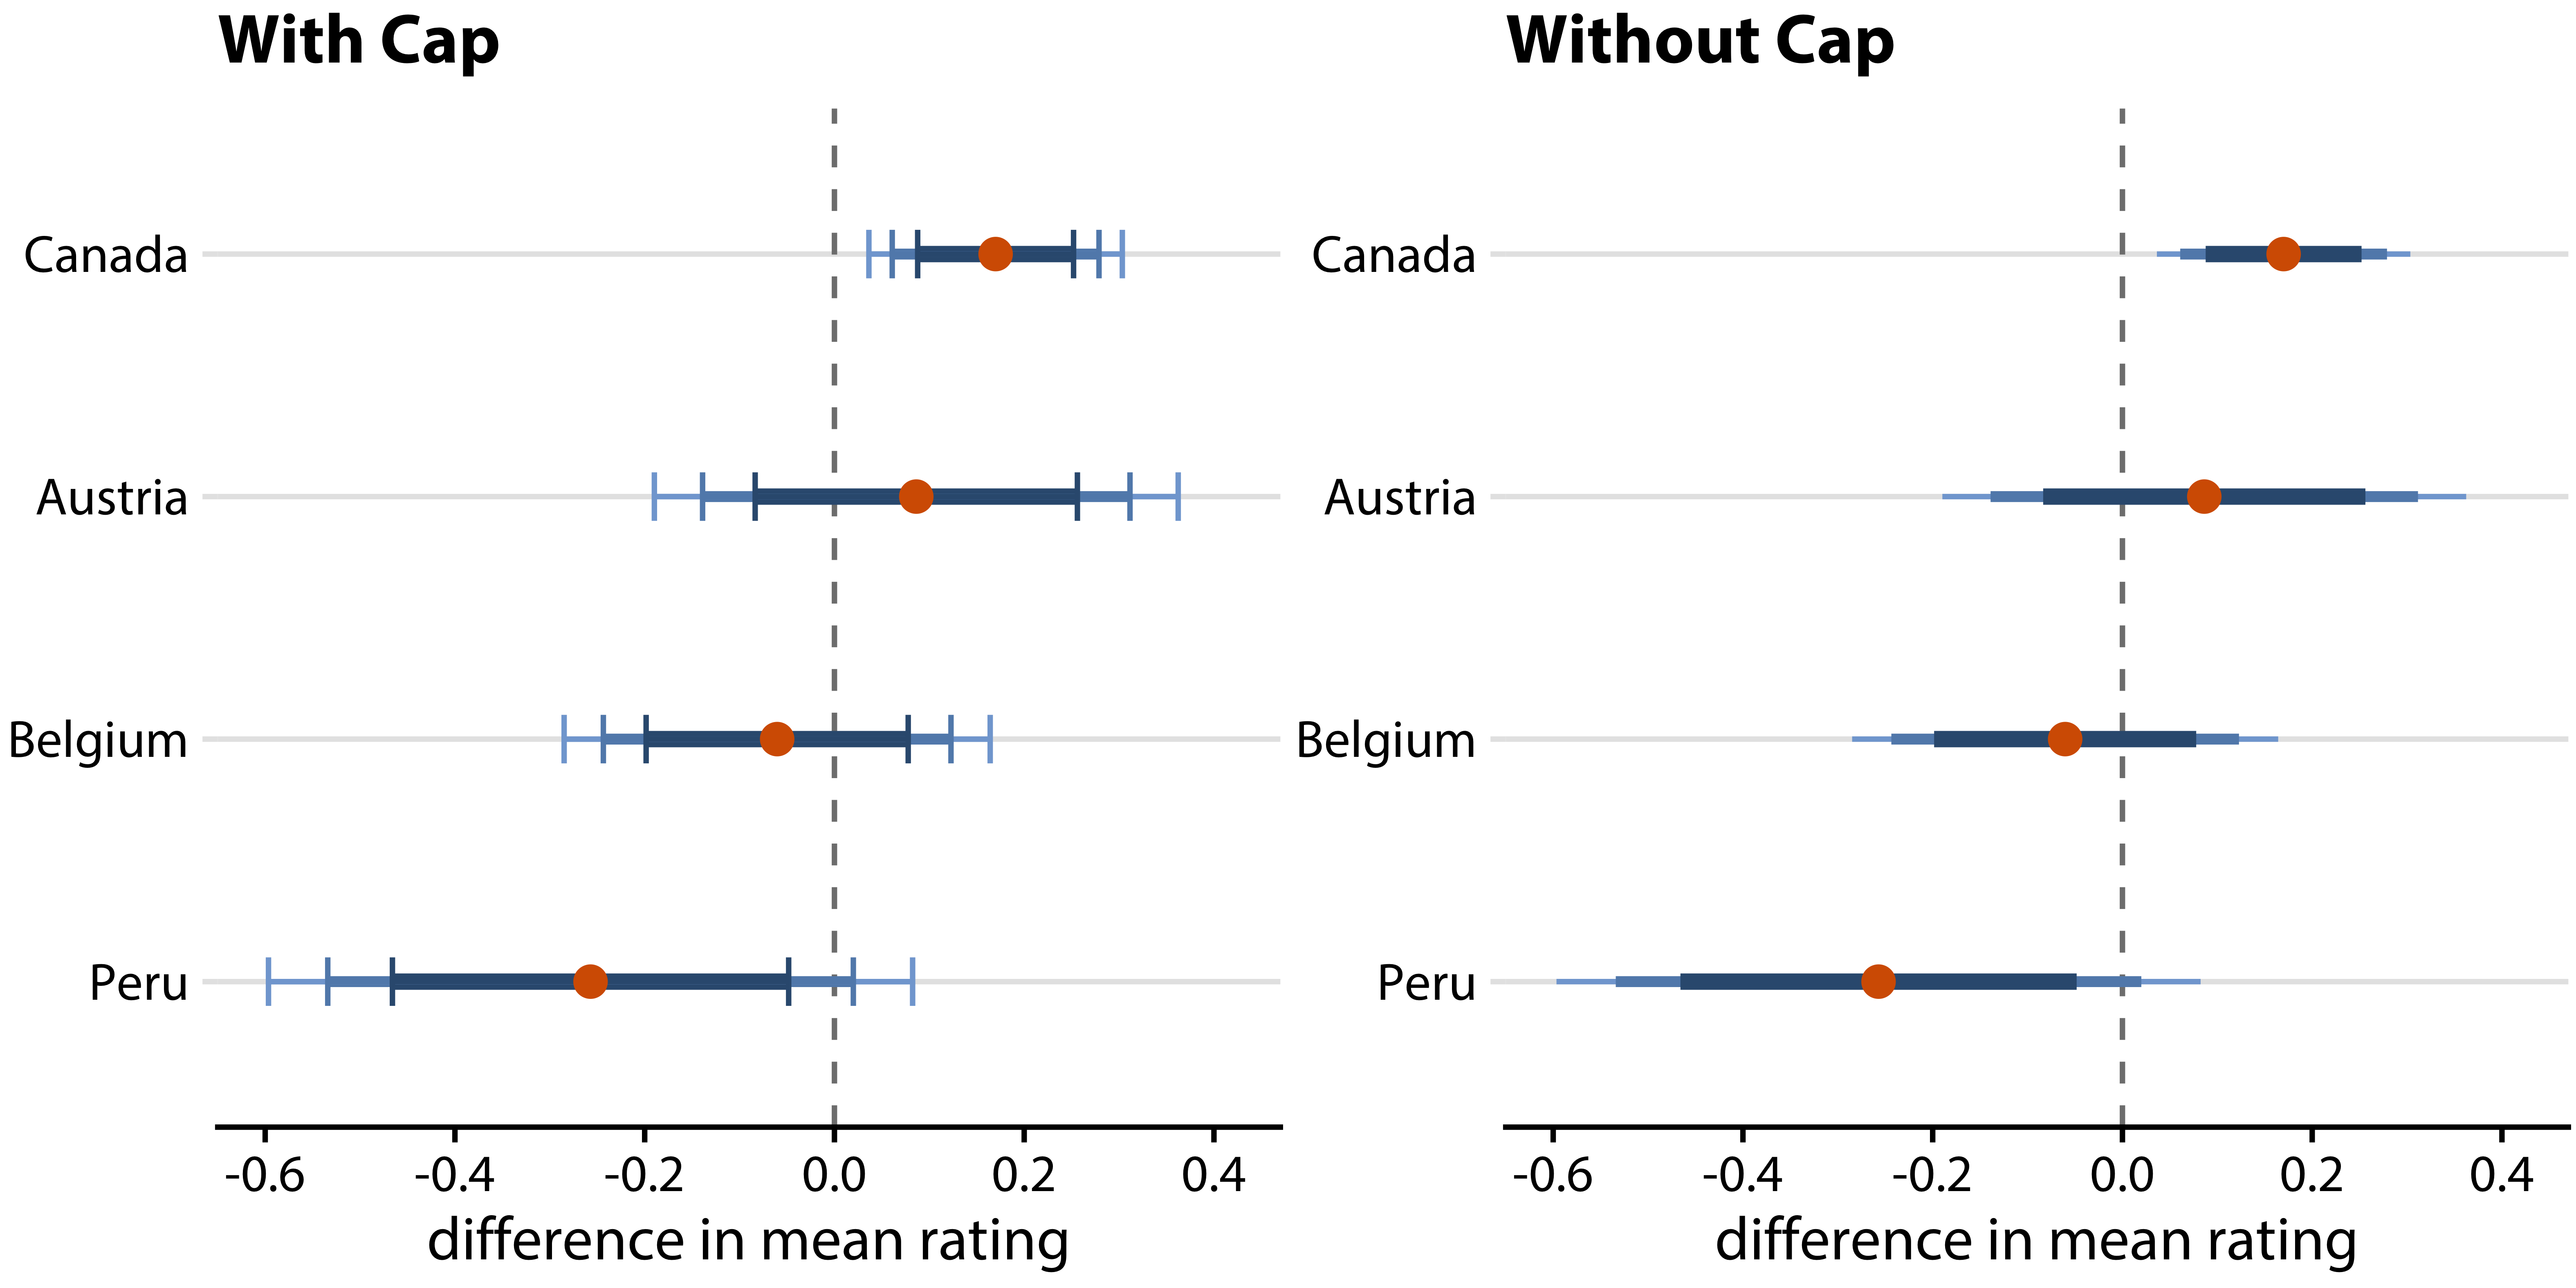
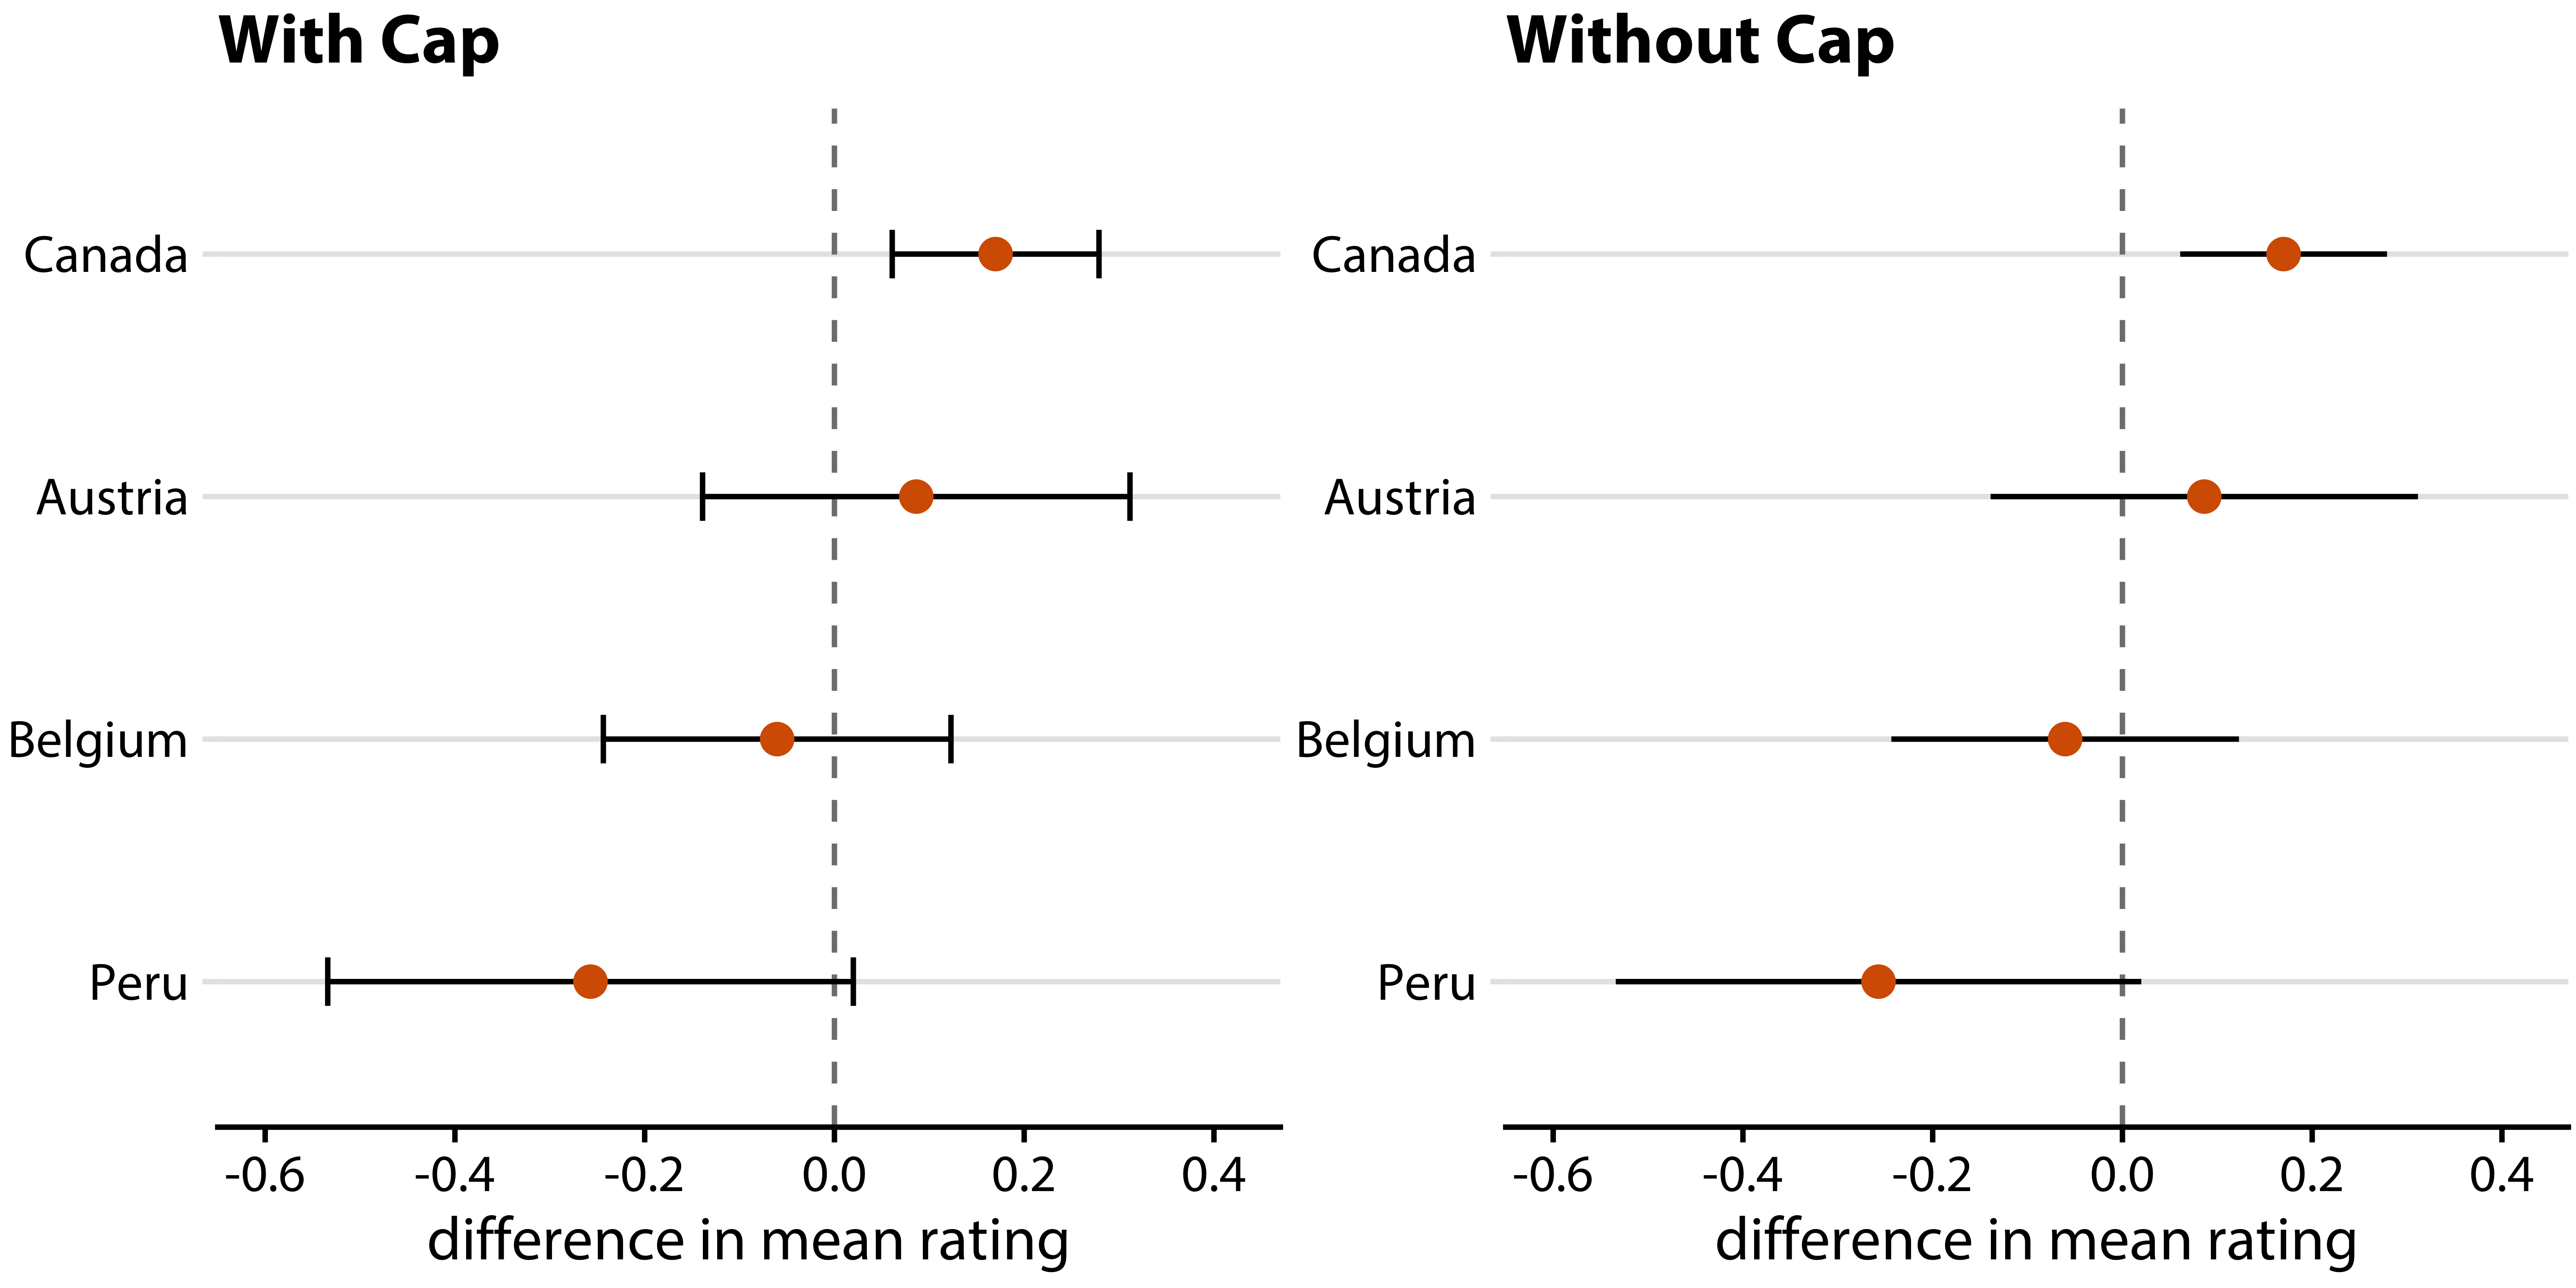
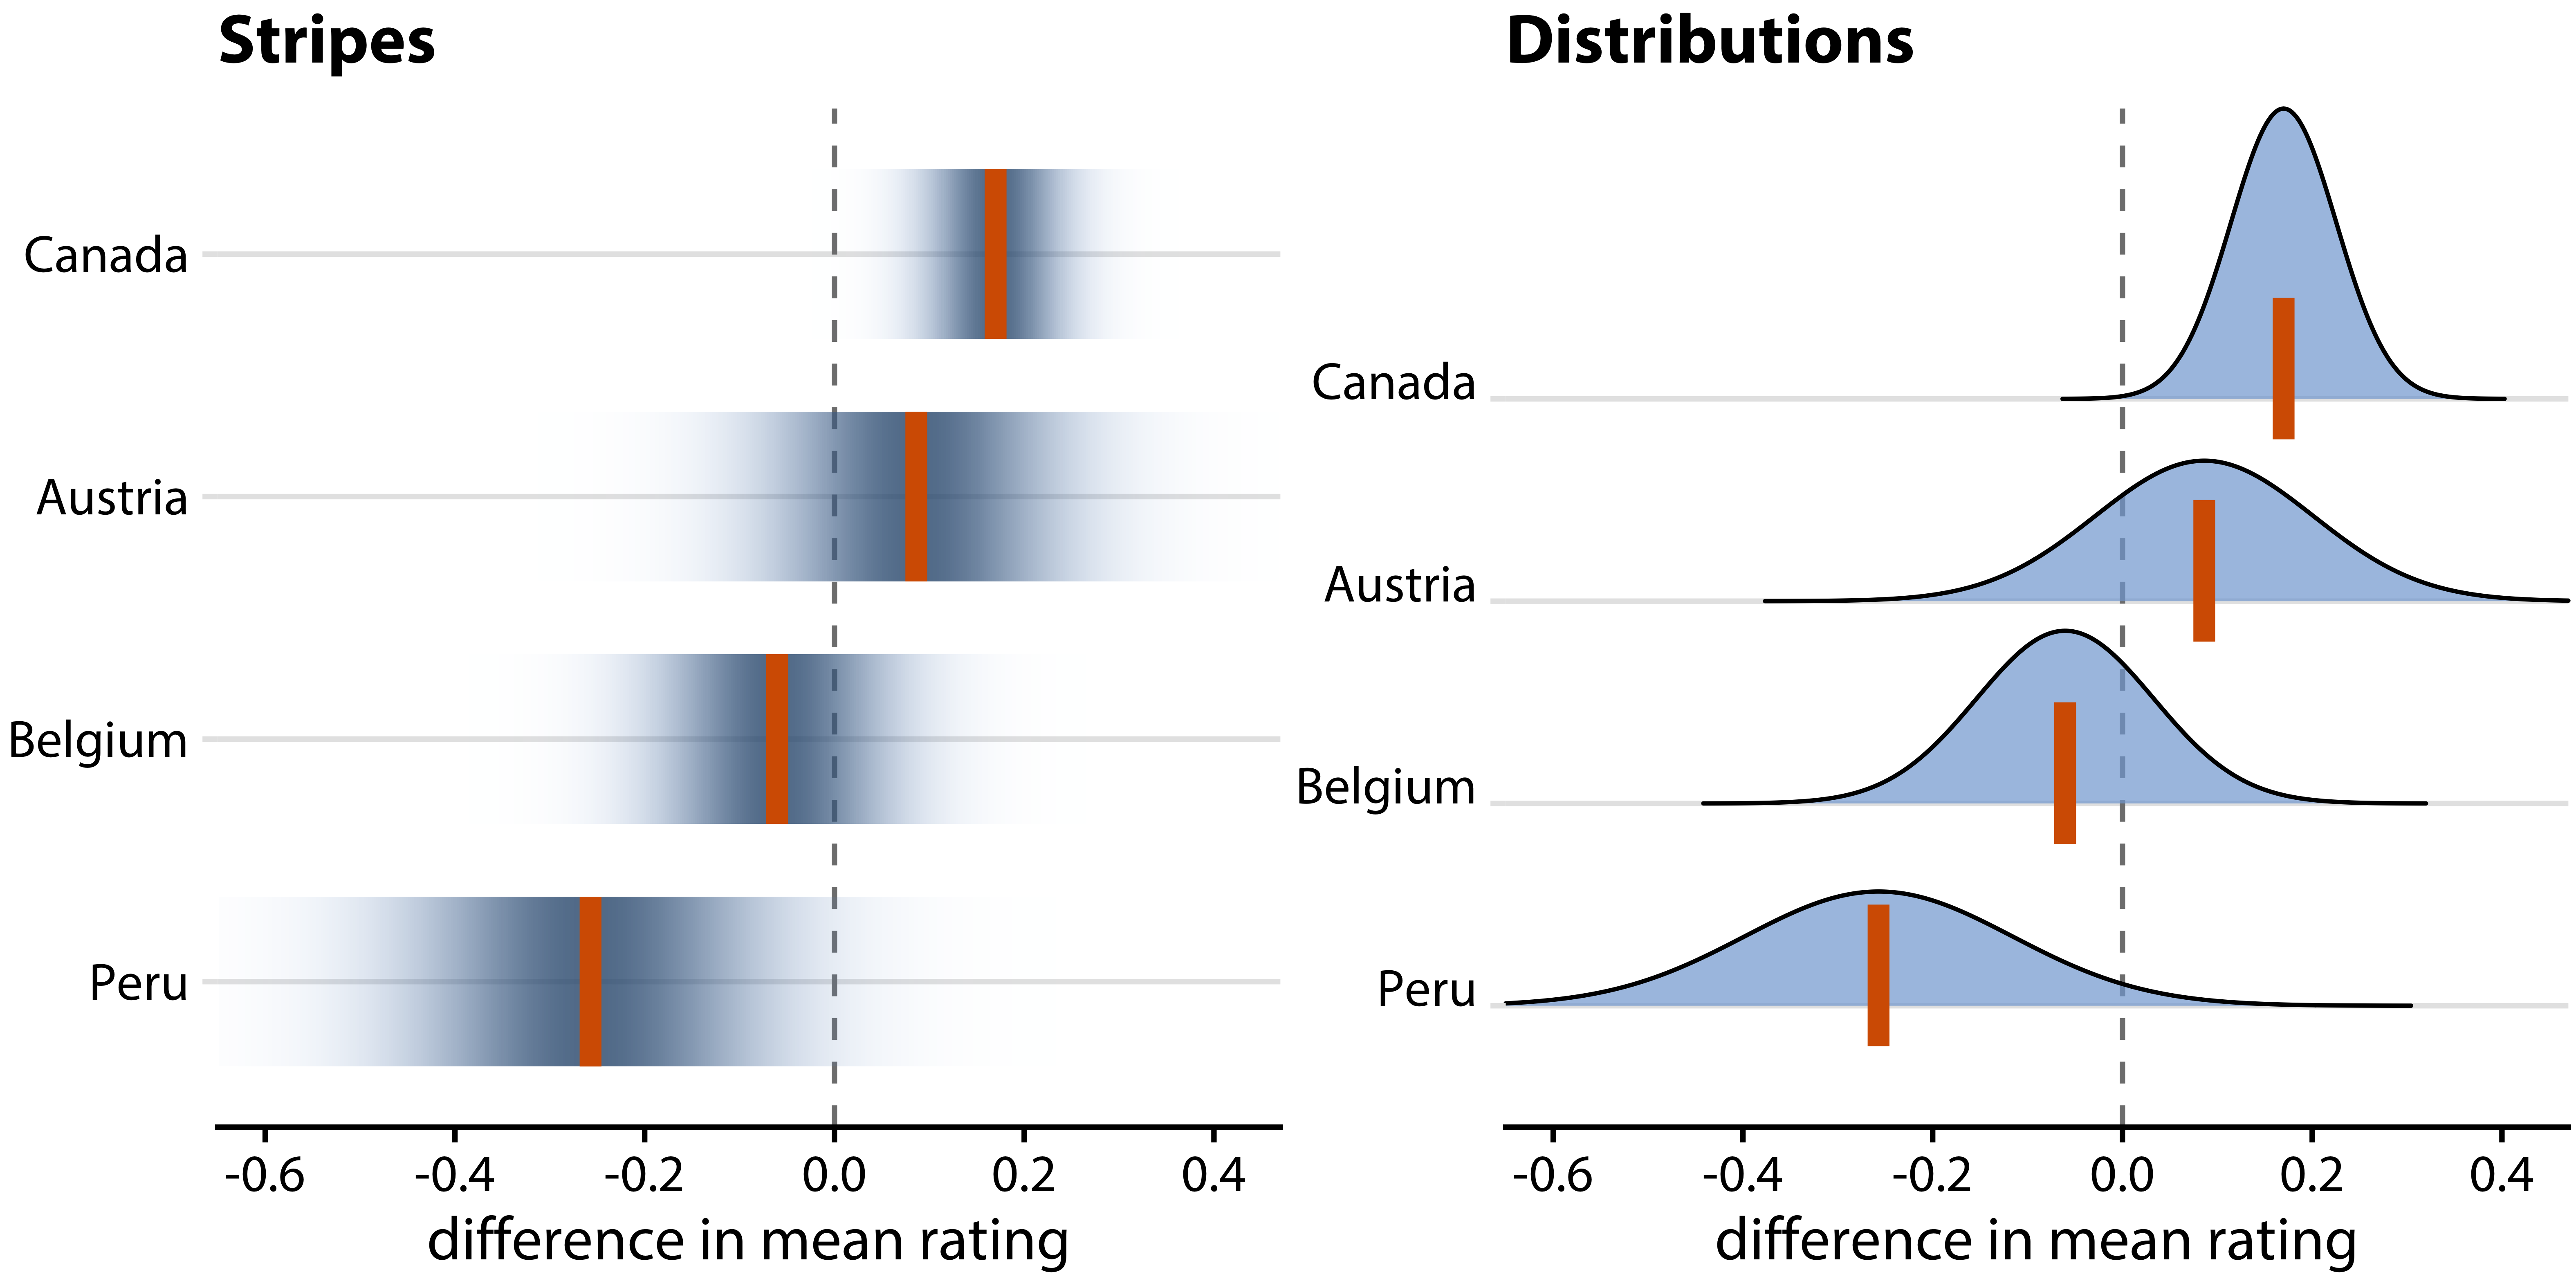
Which approach is best? Why?
Advantages of error bars
Bayesian statistics
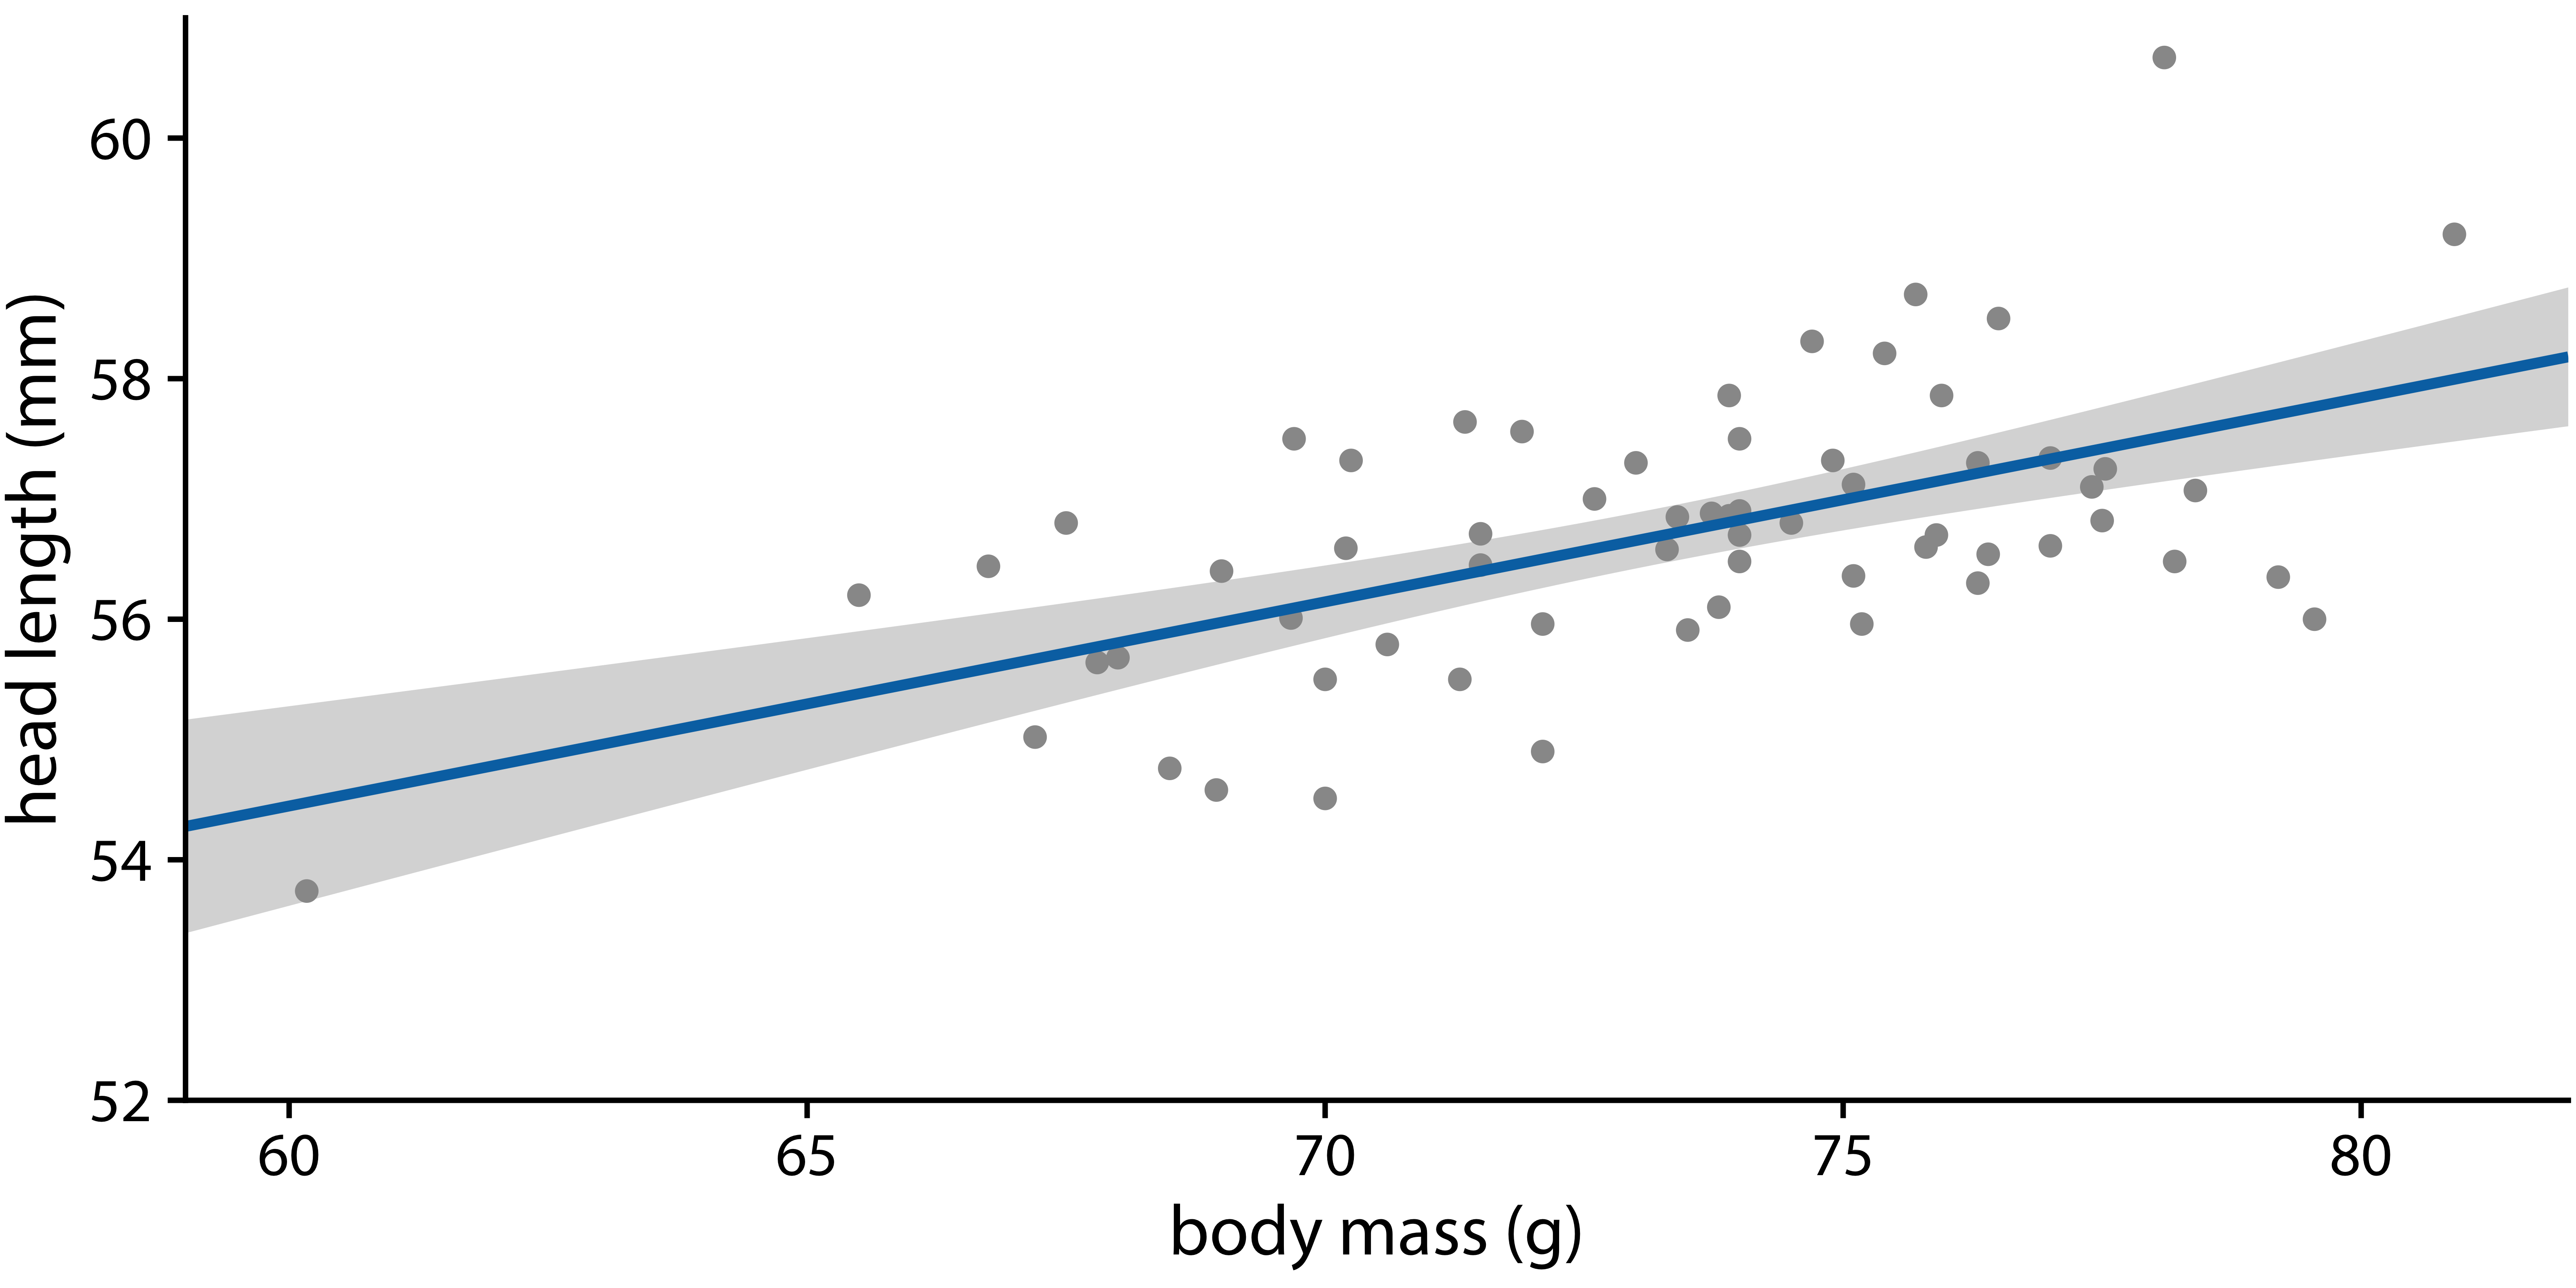
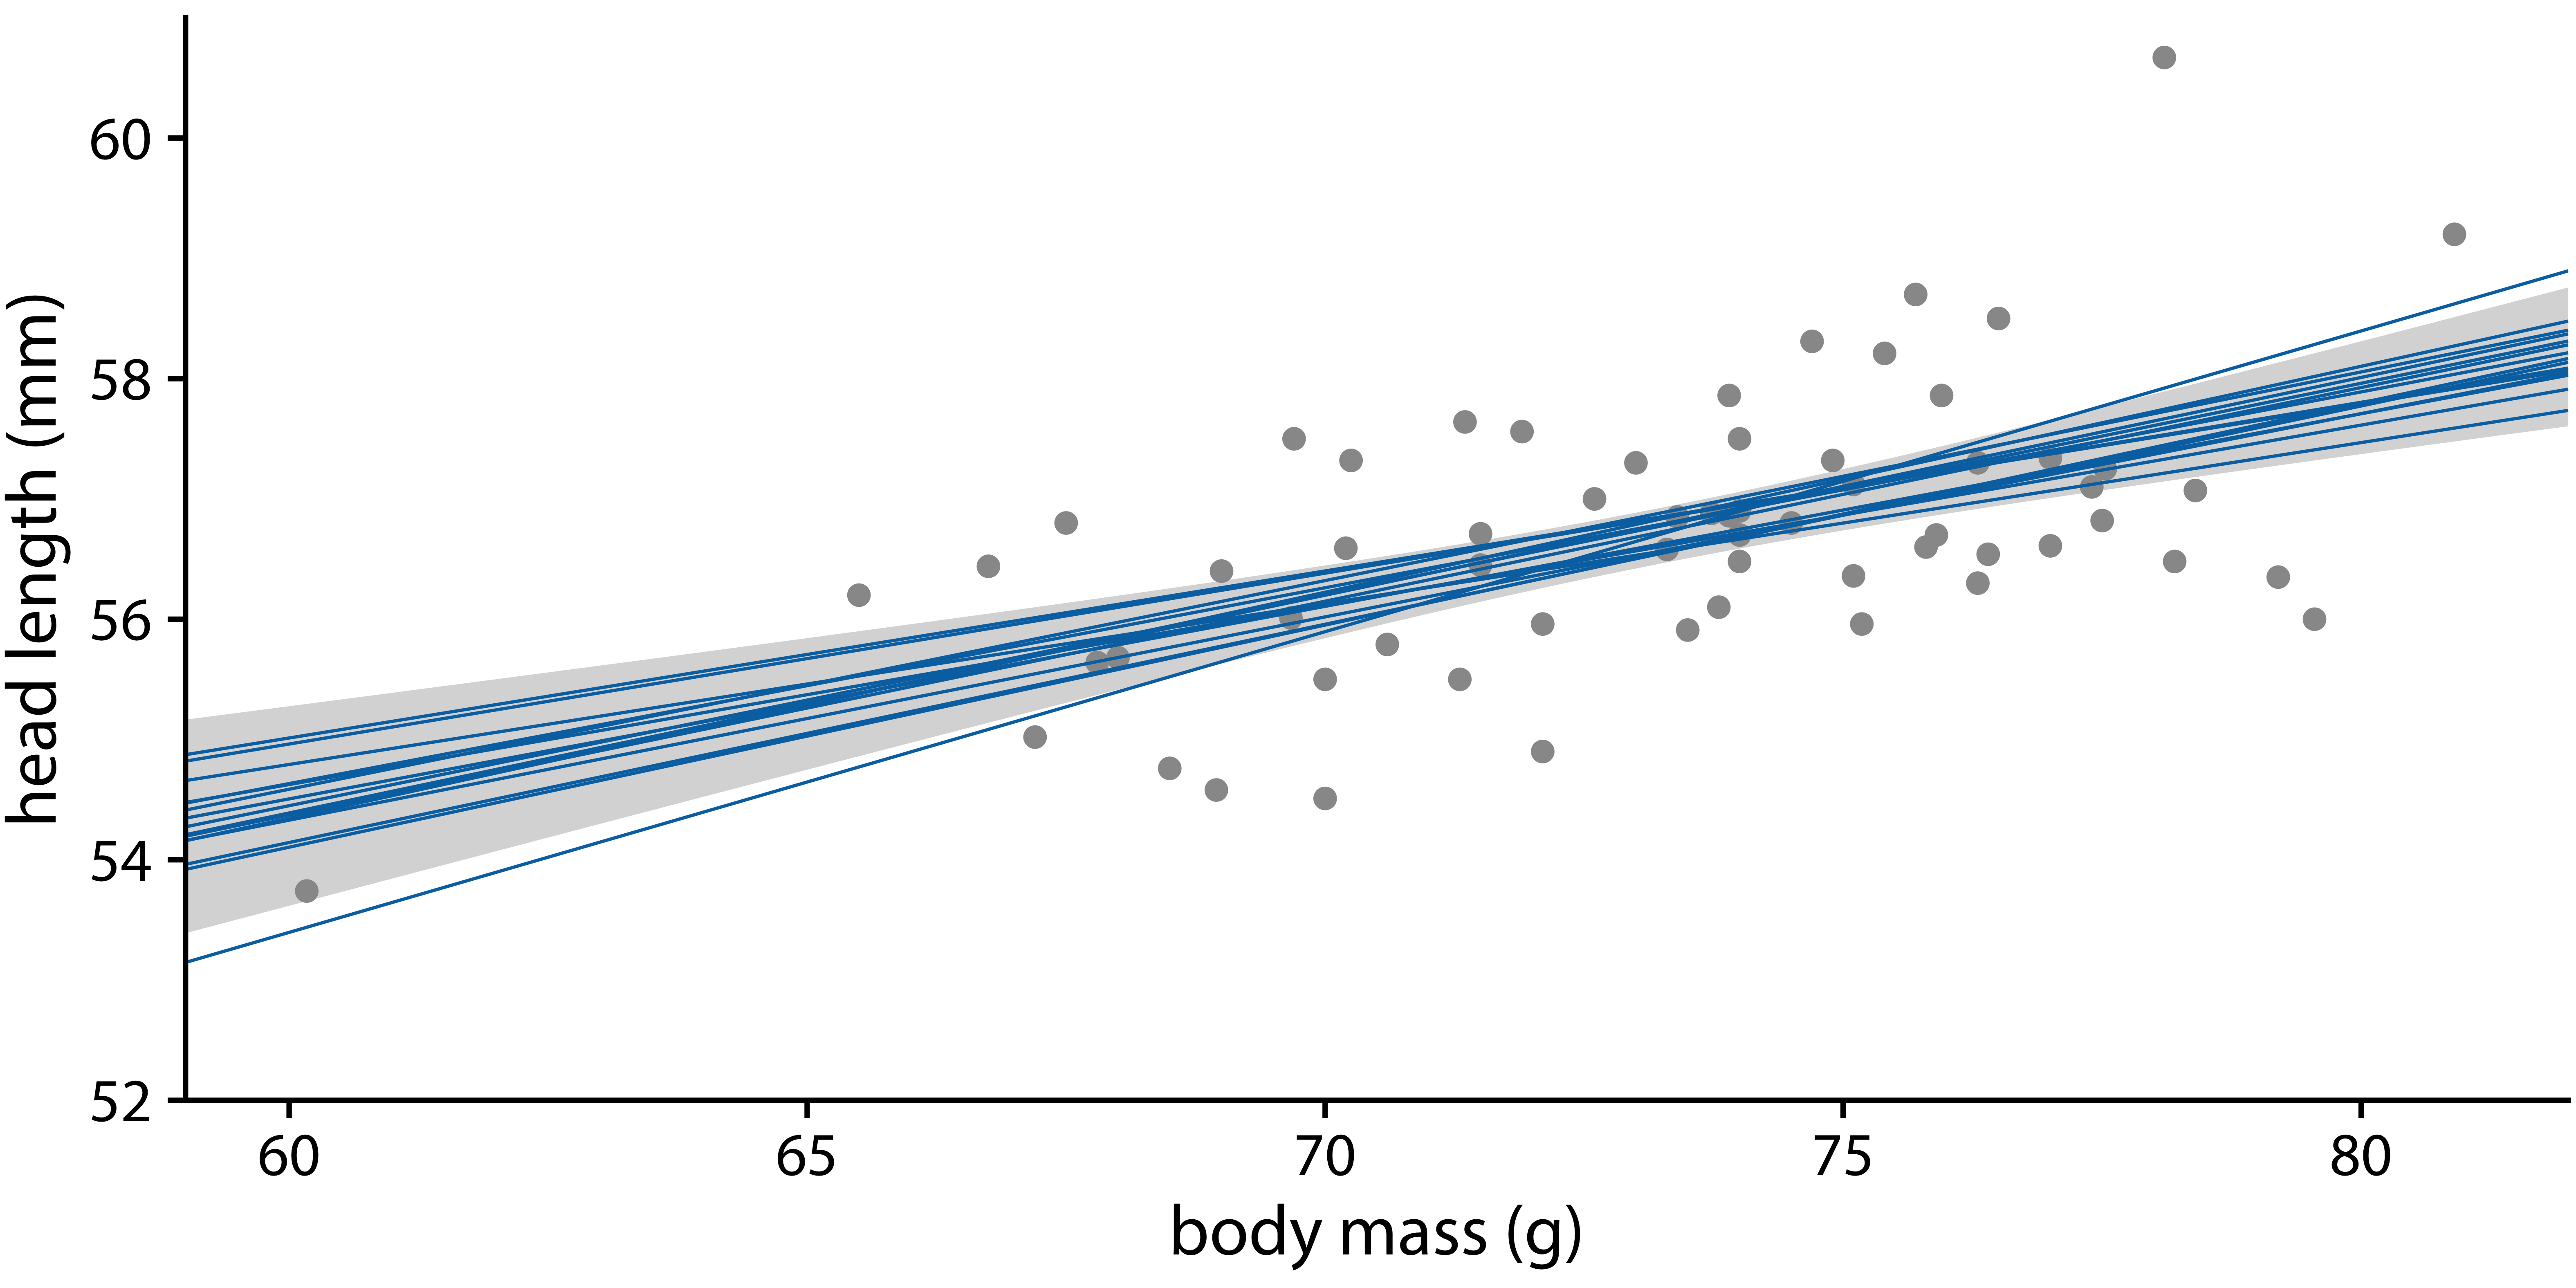
Uncertainty of curve fits
Non-linear outcomes
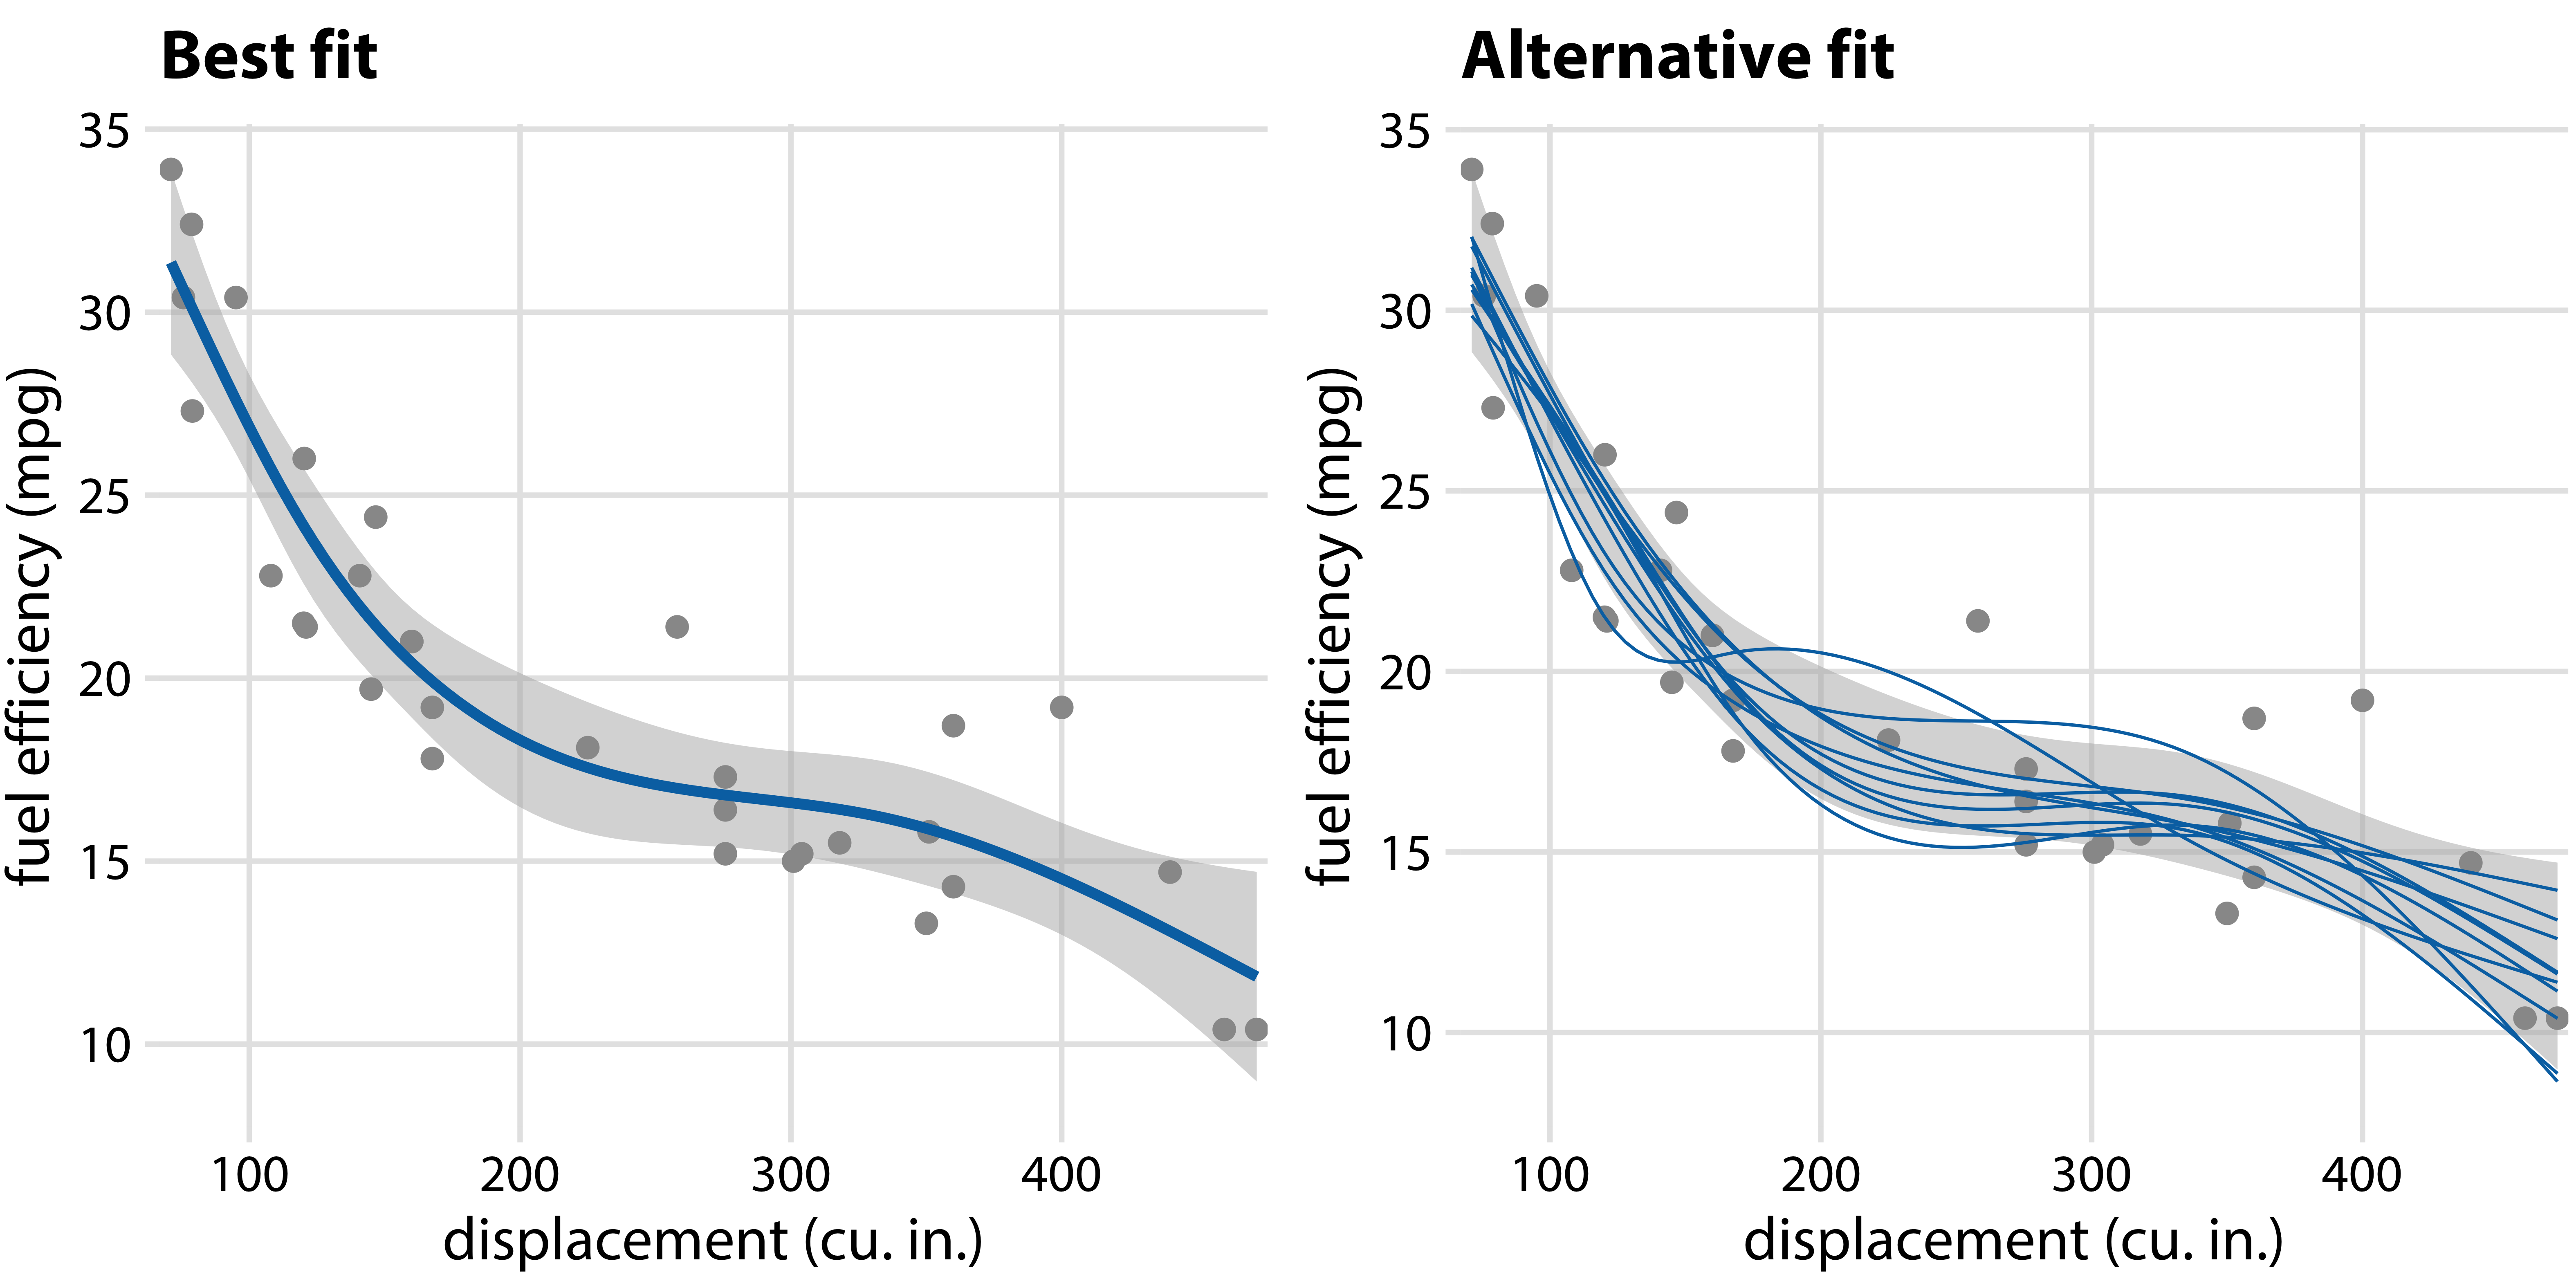
Hypothetical outcome plot
![]()