# load packages
library(countdown)
library(tidyverse)
library(lubridate)
library(janitor)
library(colorspace)
library(broom)
library(fs)

# set theme for ggplot2
ggplot2::theme_set(ggplot2::theme_minimal(base_size = 14))

# set width of code output
options(width = 65)

# set figure parameters for knitr
knitr::opts_chunk$set(
  fig.width = 7, # 7" width
  fig.asp = 0.618, # the golden ratio
  fig.retina = 3, # dpi multiplier for displaying HTML output on retina
  fig.align = "center", # center align figures
  dpi = 300 # higher dpi, sharper image
)Visualizing time series data I
Lecture 9
University of Arizona
INFO 526 - Fall 2023
Warm up
Announcements
Final Project 1 due Monday, October 16th, 3pm
Project 1 presentations – Monday October 16th in class, all team members must be there
Setup
Working with dates
Air Quality Index
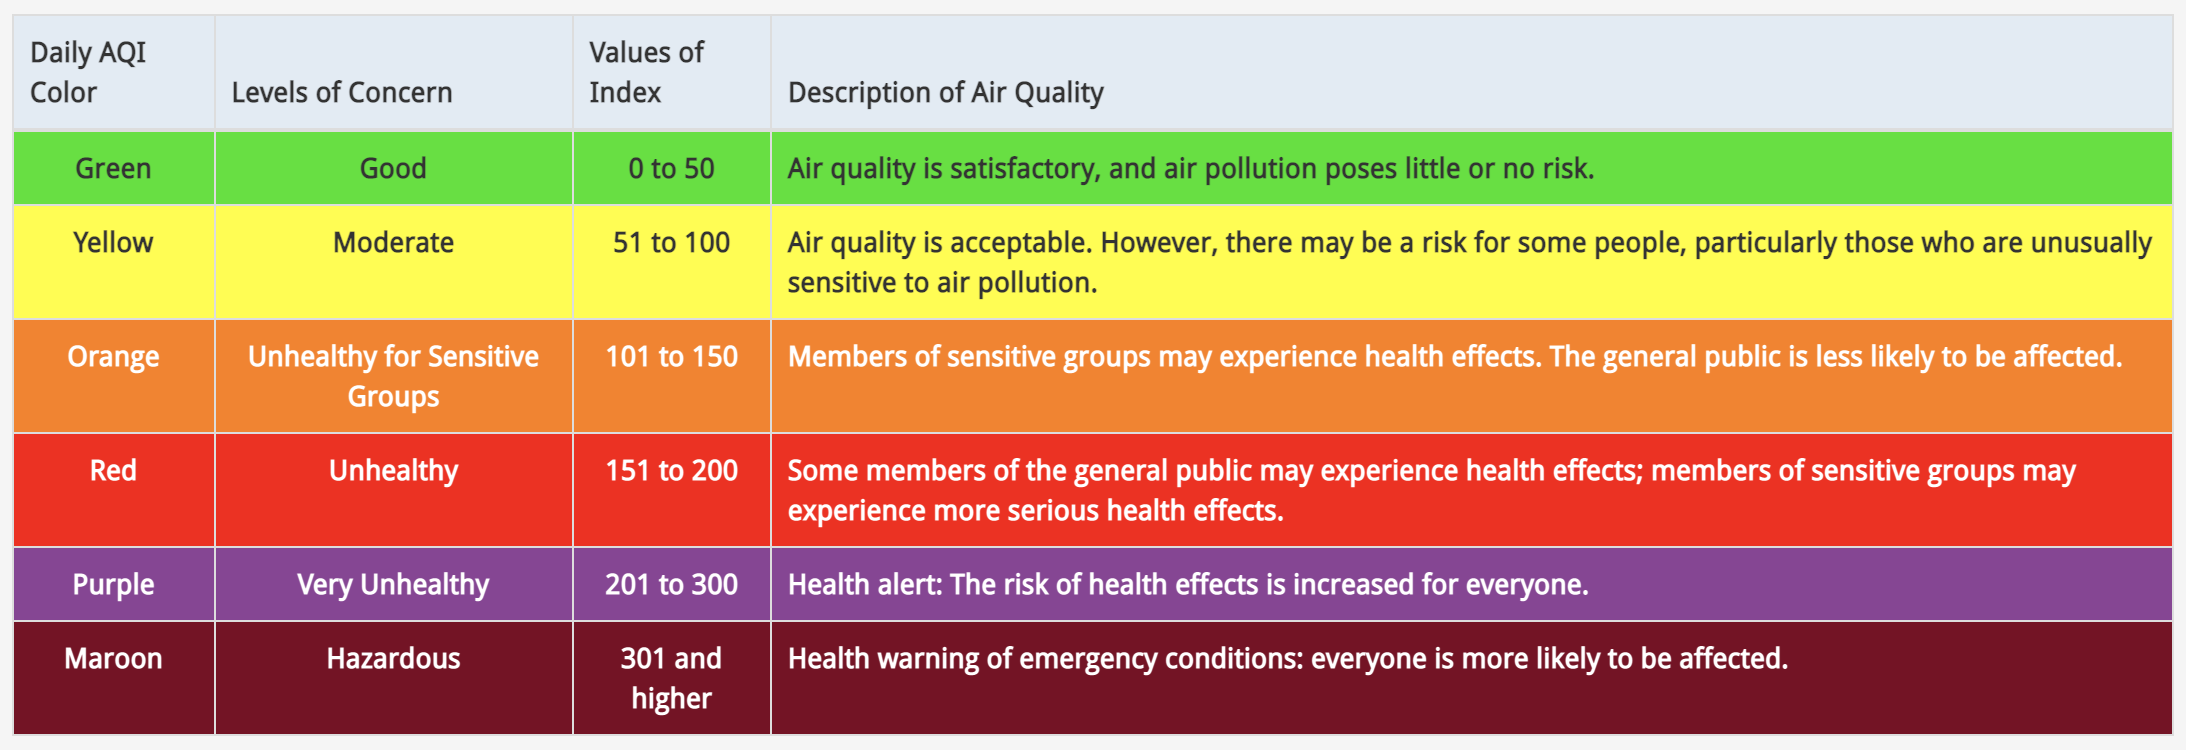
The AQI is the Environmental Protection Agency’s index for reporting air quality
Higher values of AQI indicate worse air quality

AQI levels
The previous graphic in tibble form, to be used later…
AQI data
Source: EPA’s Daily Air Quality Tracker
2016 - 2022 AQI (Ozone and PM2.5 combined) for Tucson, AZ core-based statistical area (CBSA), one file per year
2016 - 2022 AQI (Ozone and PM2.5 combined) for San Francisco-Oakland-Hayward, CA CBSA, one file per year
2022 Tucson, AZ
- Load data
Clean variable names
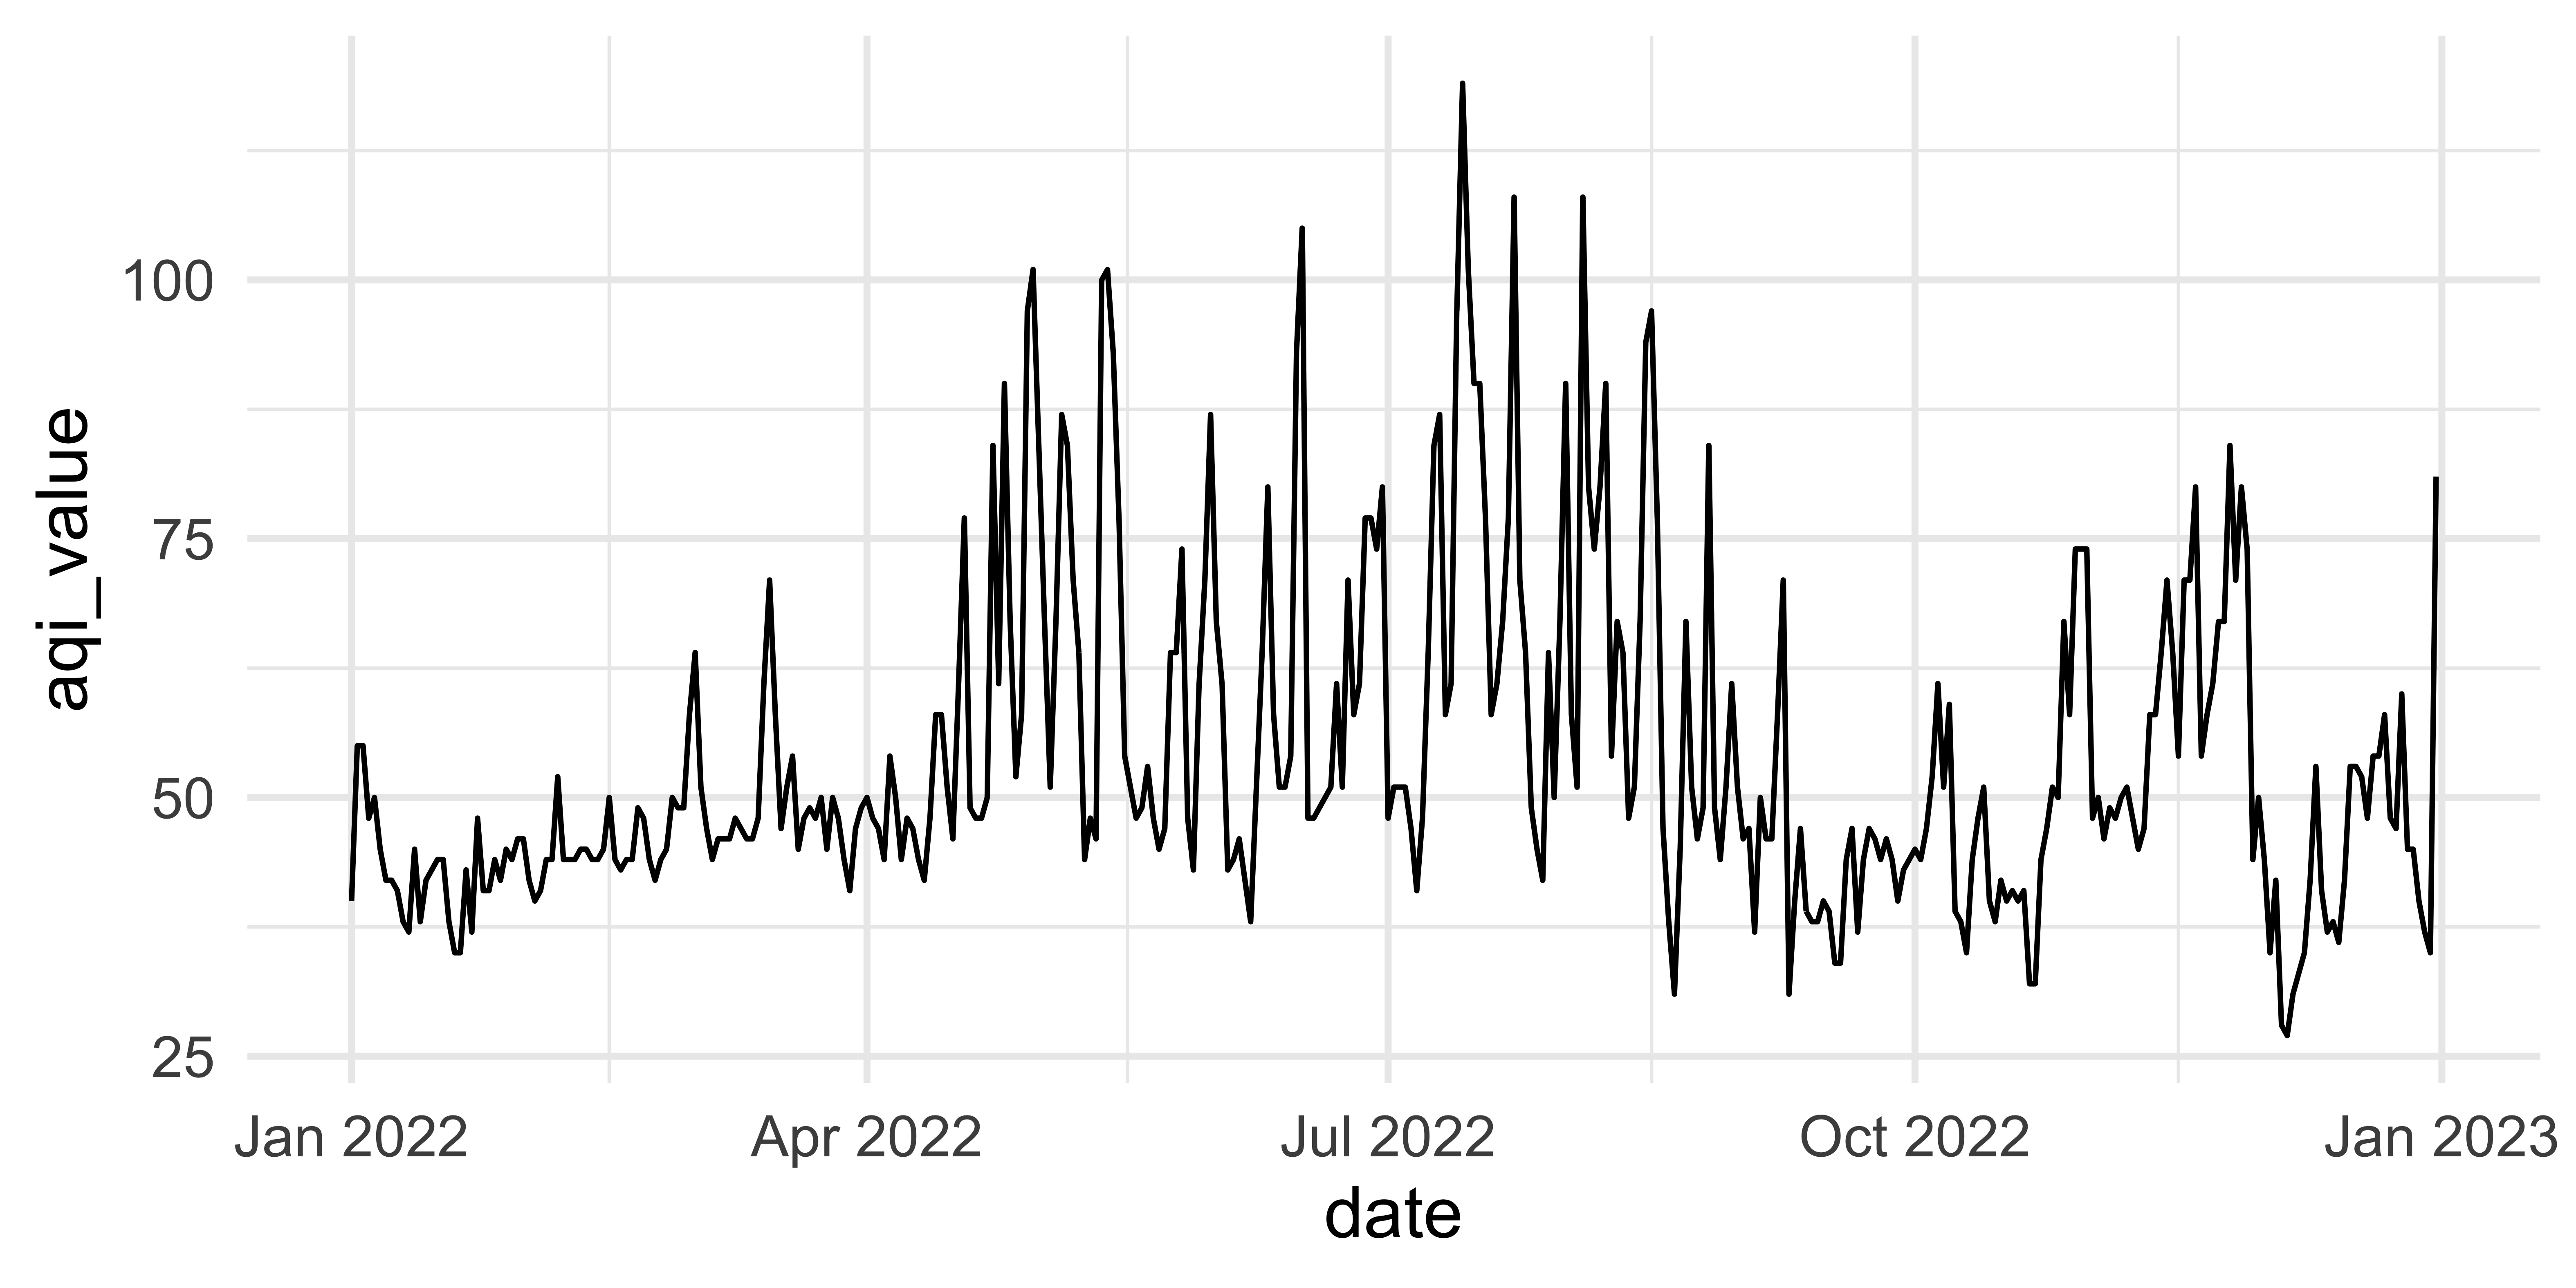
First look
This plot looks quite bizarre. What might be going on?

Peek at data
# A tibble: 365 × 4
   date       aqi_value site_name    site_id
   <chr>          <dbl> <chr>        <chr>
 1 01/01/2022        40 GERONIMO     04-019-1113
 2 01/02/2022        55 GERONIMO     04-019-1113
 3 01/03/2022        55 GERONIMO     04-019-1113
 4 01/04/2022        48 GERONIMO     04-019-1113
 5 01/05/2022        50 GERONIMO     04-019-1113
 6 01/06/2022        45 GERONIMO     04-019-1113
 7 01/07/2022        42 SAGUARO PARK 04-019-0021
 8 01/08/2022        42 SAGUARO PARK 04-019-0021
 9 01/09/2022        41 GERONIMO     04-019-1113
10 01/10/2022        38 FAIRGROUNDS  04-019-1020
# ℹ 355 more rows
Transforming date
Using lubridate::mdy():
# A tibble: 365 × 11
   date       aqi_value main_pollutant site_name   site_id source
   <date>         <dbl> <chr>          <chr>       <chr>   <chr>
 1 2022-01-01        40 PM2.5          GERONIMO    04-019… AQS
 2 2022-01-02        55 PM2.5          GERONIMO    04-019… AQS
 3 2022-01-03        55 PM2.5          GERONIMO    04-019… AQS
 4 2022-01-04        48 PM2.5          GERONIMO    04-019… AQS
 5 2022-01-05        50 PM2.5          GERONIMO    04-019… AQS
 6 2022-01-06        45 PM2.5          GERONIMO    04-019… AQS
 7 2022-01-07        42 Ozone          SAGUARO PA… 04-019… AQS
 8 2022-01-08        42 Ozone          SAGUARO PA… 04-019… AQS
 9 2022-01-09        41 PM2.5          GERONIMO    04-019… AQS
10 2022-01-10        38 Ozone          FAIRGROUNDS 04-019… AQS
# ℹ 355 more rows
# ℹ 5 more variables: x20_year_high_2000_2019 <dbl>,
#   x20_year_low_2000_2019 <dbl>,
#   x5_year_average_2015_2019 <dbl>, date_of_20_year_high <chr>,
#   date_of_20_year_low <chr>
Transforming AQI values
What does this warning mean?
# A tibble: 365 × 11
  date       aqi_value main_pollutant site_name site_id    source
  <chr>          <dbl> <chr>          <chr>     <chr>      <chr>
1 01/01/2022        40 PM2.5          GERONIMO  04-019-11… AQS
2 01/02/2022        55 PM2.5          GERONIMO  04-019-11… AQS
3 01/03/2022        55 PM2.5          GERONIMO  04-019-11… AQS
# ℹ 362 more rows
# ℹ 5 more variables: x20_year_high_2000_2019 <dbl>,
#   x20_year_low_2000_2019 <dbl>,
#   x5_year_average_2015_2019 <dbl>, date_of_20_year_high <chr>,
#   date_of_20_year_low <chr>
Investigating AQI values
- Take a peek at distinct values of AQI
 [1]  40  55  48  50  45  42  41  38  37  43  44  35  46  52  49
[16]  58  64  51  47  61  71  54  77  84  90  67  97 101  87 100
[31]  93  53  74  80 105 119 108  94  31  39  34  59  32  28  27
[46] 33 36 60 81"."likely indicatesNA, and it’s causing the entire column to be read in as characters
Rewind, and start over
Rows: 365
Columns: 11
$ Date                         <chr> "01/01/2022", "01/02/2022"…
$ `AQI Value`                  <dbl> 40, 55, 55, 48, 50, 45, 42…
$ `Main Pollutant`             <chr> "PM2.5", "PM2.5", "PM2.5",…
$ `Site Name`                  <chr> "GERONIMO", "GERONIMO", "G…
$ `Site ID`                    <chr> "04-019-1113", "04-019-111…
$ Source                       <chr> "AQS", "AQS", "AQS", "AQS"…
$ `20-year High (2000-2019)`   <dbl> 115, 57, 67, 55, 52, 55, 5…
$ `20-year Low (2000-2019)`    <dbl> 35, 31, 29, 27, 28, 25, 31…
$ `5-year Average (2015-2019)` <dbl> 62.2, 43.2, 43.6, 40.4, 36…
$ `Date of 20-year High`       <chr> "01/01/2018", "01/02/2015"…
$ `Date of 20-year Low`        <chr> "01/01/2001", "01/02/2016"…
Data cleaning
# A tibble: 365 × 11
   date       aqi_value main_pollutant site_name   site_id source
   <date>         <dbl> <chr>          <chr>       <chr>   <chr>
 1 2022-01-01        40 PM2.5          GERONIMO    04-019… AQS
 2 2022-01-02        55 PM2.5          GERONIMO    04-019… AQS
 3 2022-01-03        55 PM2.5          GERONIMO    04-019… AQS
 4 2022-01-04        48 PM2.5          GERONIMO    04-019… AQS
 5 2022-01-05        50 PM2.5          GERONIMO    04-019… AQS
 6 2022-01-06        45 PM2.5          GERONIMO    04-019… AQS
 7 2022-01-07        42 Ozone          SAGUARO PA… 04-019… AQS
 8 2022-01-08        42 Ozone          SAGUARO PA… 04-019… AQS
 9 2022-01-09        41 PM2.5          GERONIMO    04-019… AQS
10 2022-01-10        38 Ozone          FAIRGROUNDS 04-019… AQS
# ℹ 355 more rows
# ℹ 5 more variables: x20_year_high_2000_2019 <dbl>,
#   x20_year_low_2000_2019 <dbl>,
#   x5_year_average_2015_2019 <dbl>, date_of_20_year_high <chr>,
#   date_of_20_year_low <chr>
Another look
How would you improve this visualization?

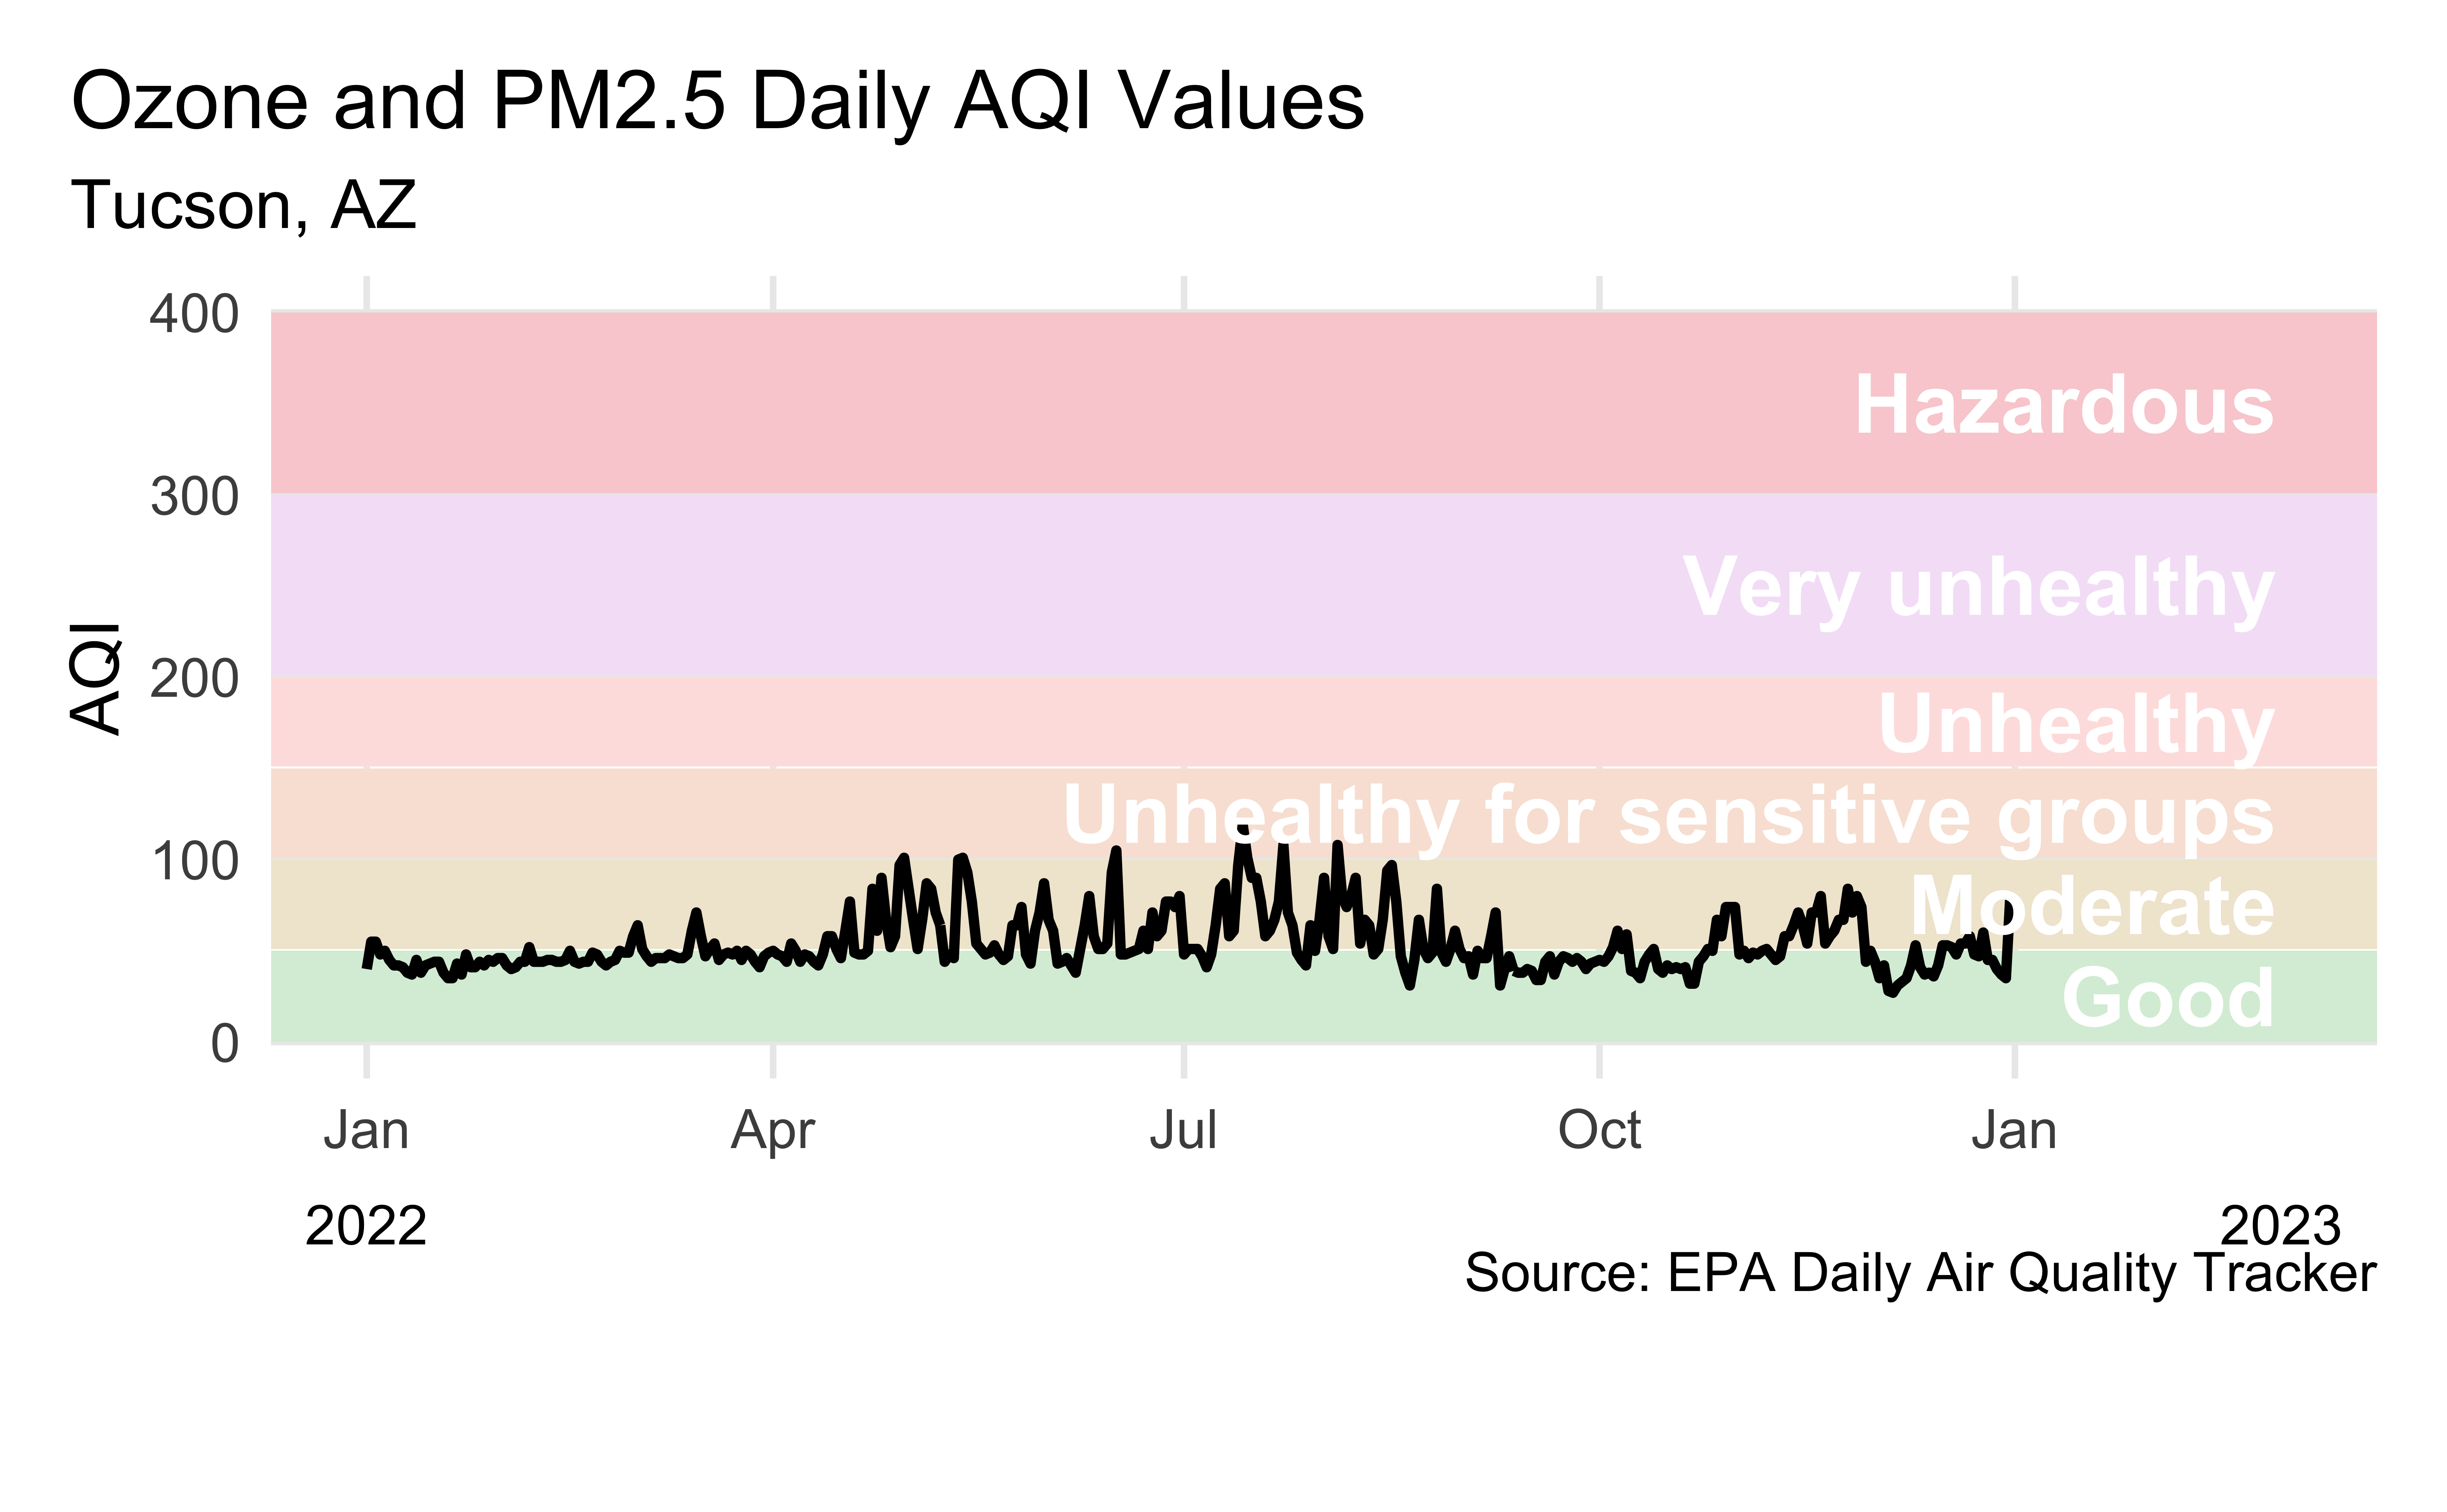
Visualizing Tucson AQI

Livecoding
Reveal below for code developed during live coding session.
Code
aqi_levels <- aqi_levels |>
  mutate(aqi_mid = ((aqi_min + aqi_max) / 2))

tuc_2022 |>
  filter(!is.na(aqi_value)) |>
  ggplot(aes(x = date, y = aqi_value, group = 1)) +
  geom_rect(
    data = aqi_levels,
    aes(
      ymin = aqi_min, ymax = aqi_max,
      xmin = as.Date(-Inf), xmax = as.Date(Inf),
      fill = color, y = NULL, x = NULL
    )
  ) +
  geom_line(linewidth = 1) +
  scale_fill_identity() +
  scale_x_date(
    name = NULL, date_labels = "%b",
    limits = c(ymd("2022-01-01"), ymd("2023-03-01"))
  ) +
  geom_text(
    data = aqi_levels,
    aes(x = ymd("2023-02-28"), y = aqi_mid, label = level),
    hjust = 1, size = 6, fontface = "bold", color = "white"
  ) +
  annotate(
    geom = "text",
    x = c(ymd("2022-01-01"), ymd("2023-03-01")), y = -100,
    label = c("2022", "2023"), size = 4
  ) +
  coord_cartesian(clip = "off", ylim = c(0, 400)) +
  labs(
    x = NULL, y = "AQI",
    title = "Ozone and PM2.5 Daily AQI Values",
    subtitle = "Tucson, AZ",
    caption = "\nSource: EPA Daily Air Quality Tracker"
  ) +
  theme(
    plot.title.position = "plot",
    panel.grid.minor.y = element_blank(),
    panel.grid.minor.x = element_blank(),
    plot.margin = unit(c(1, 1, 3, 1), "lines")
  )

