Welcome to INFO 526
Data Visualization and Analysis
ggplot2 ∈ tidyverse
ggplot2 is tidyverse’s data visualization package
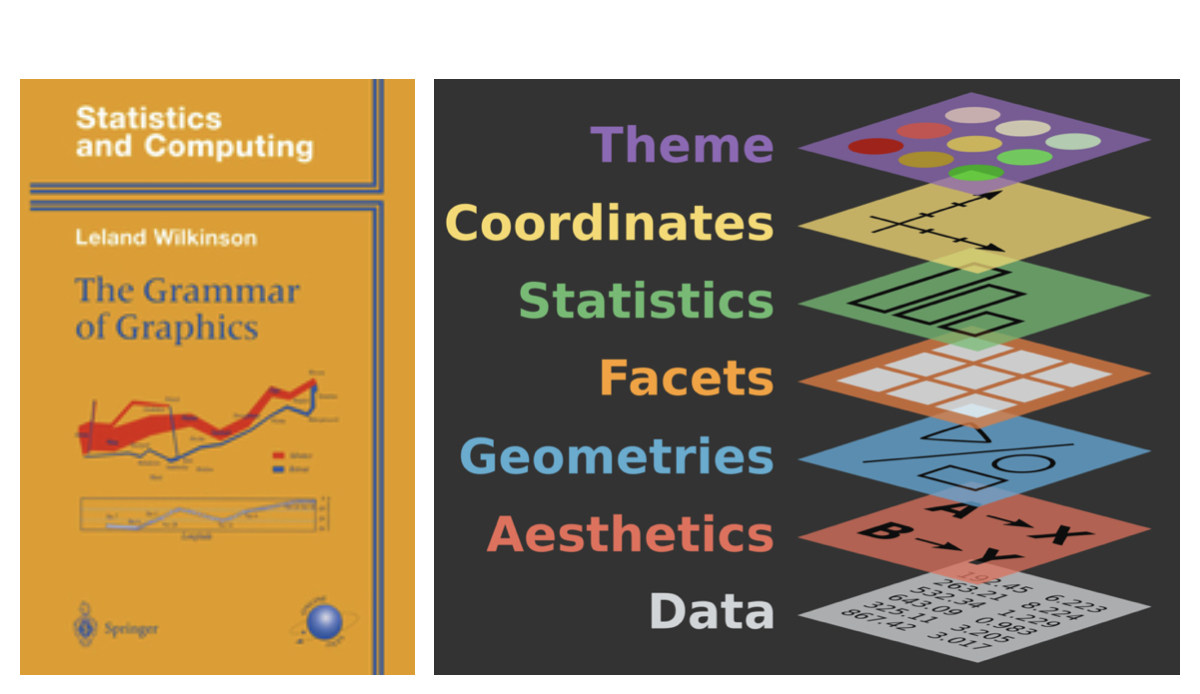
ggin “ggplot2” stands for Grammar of GraphicsInspired by the book Grammar of Graphics by Leland Wilkinson
Grammar of Graphics
A grammar of graphics is a tool that enables us to concisely describe the components of a graphic
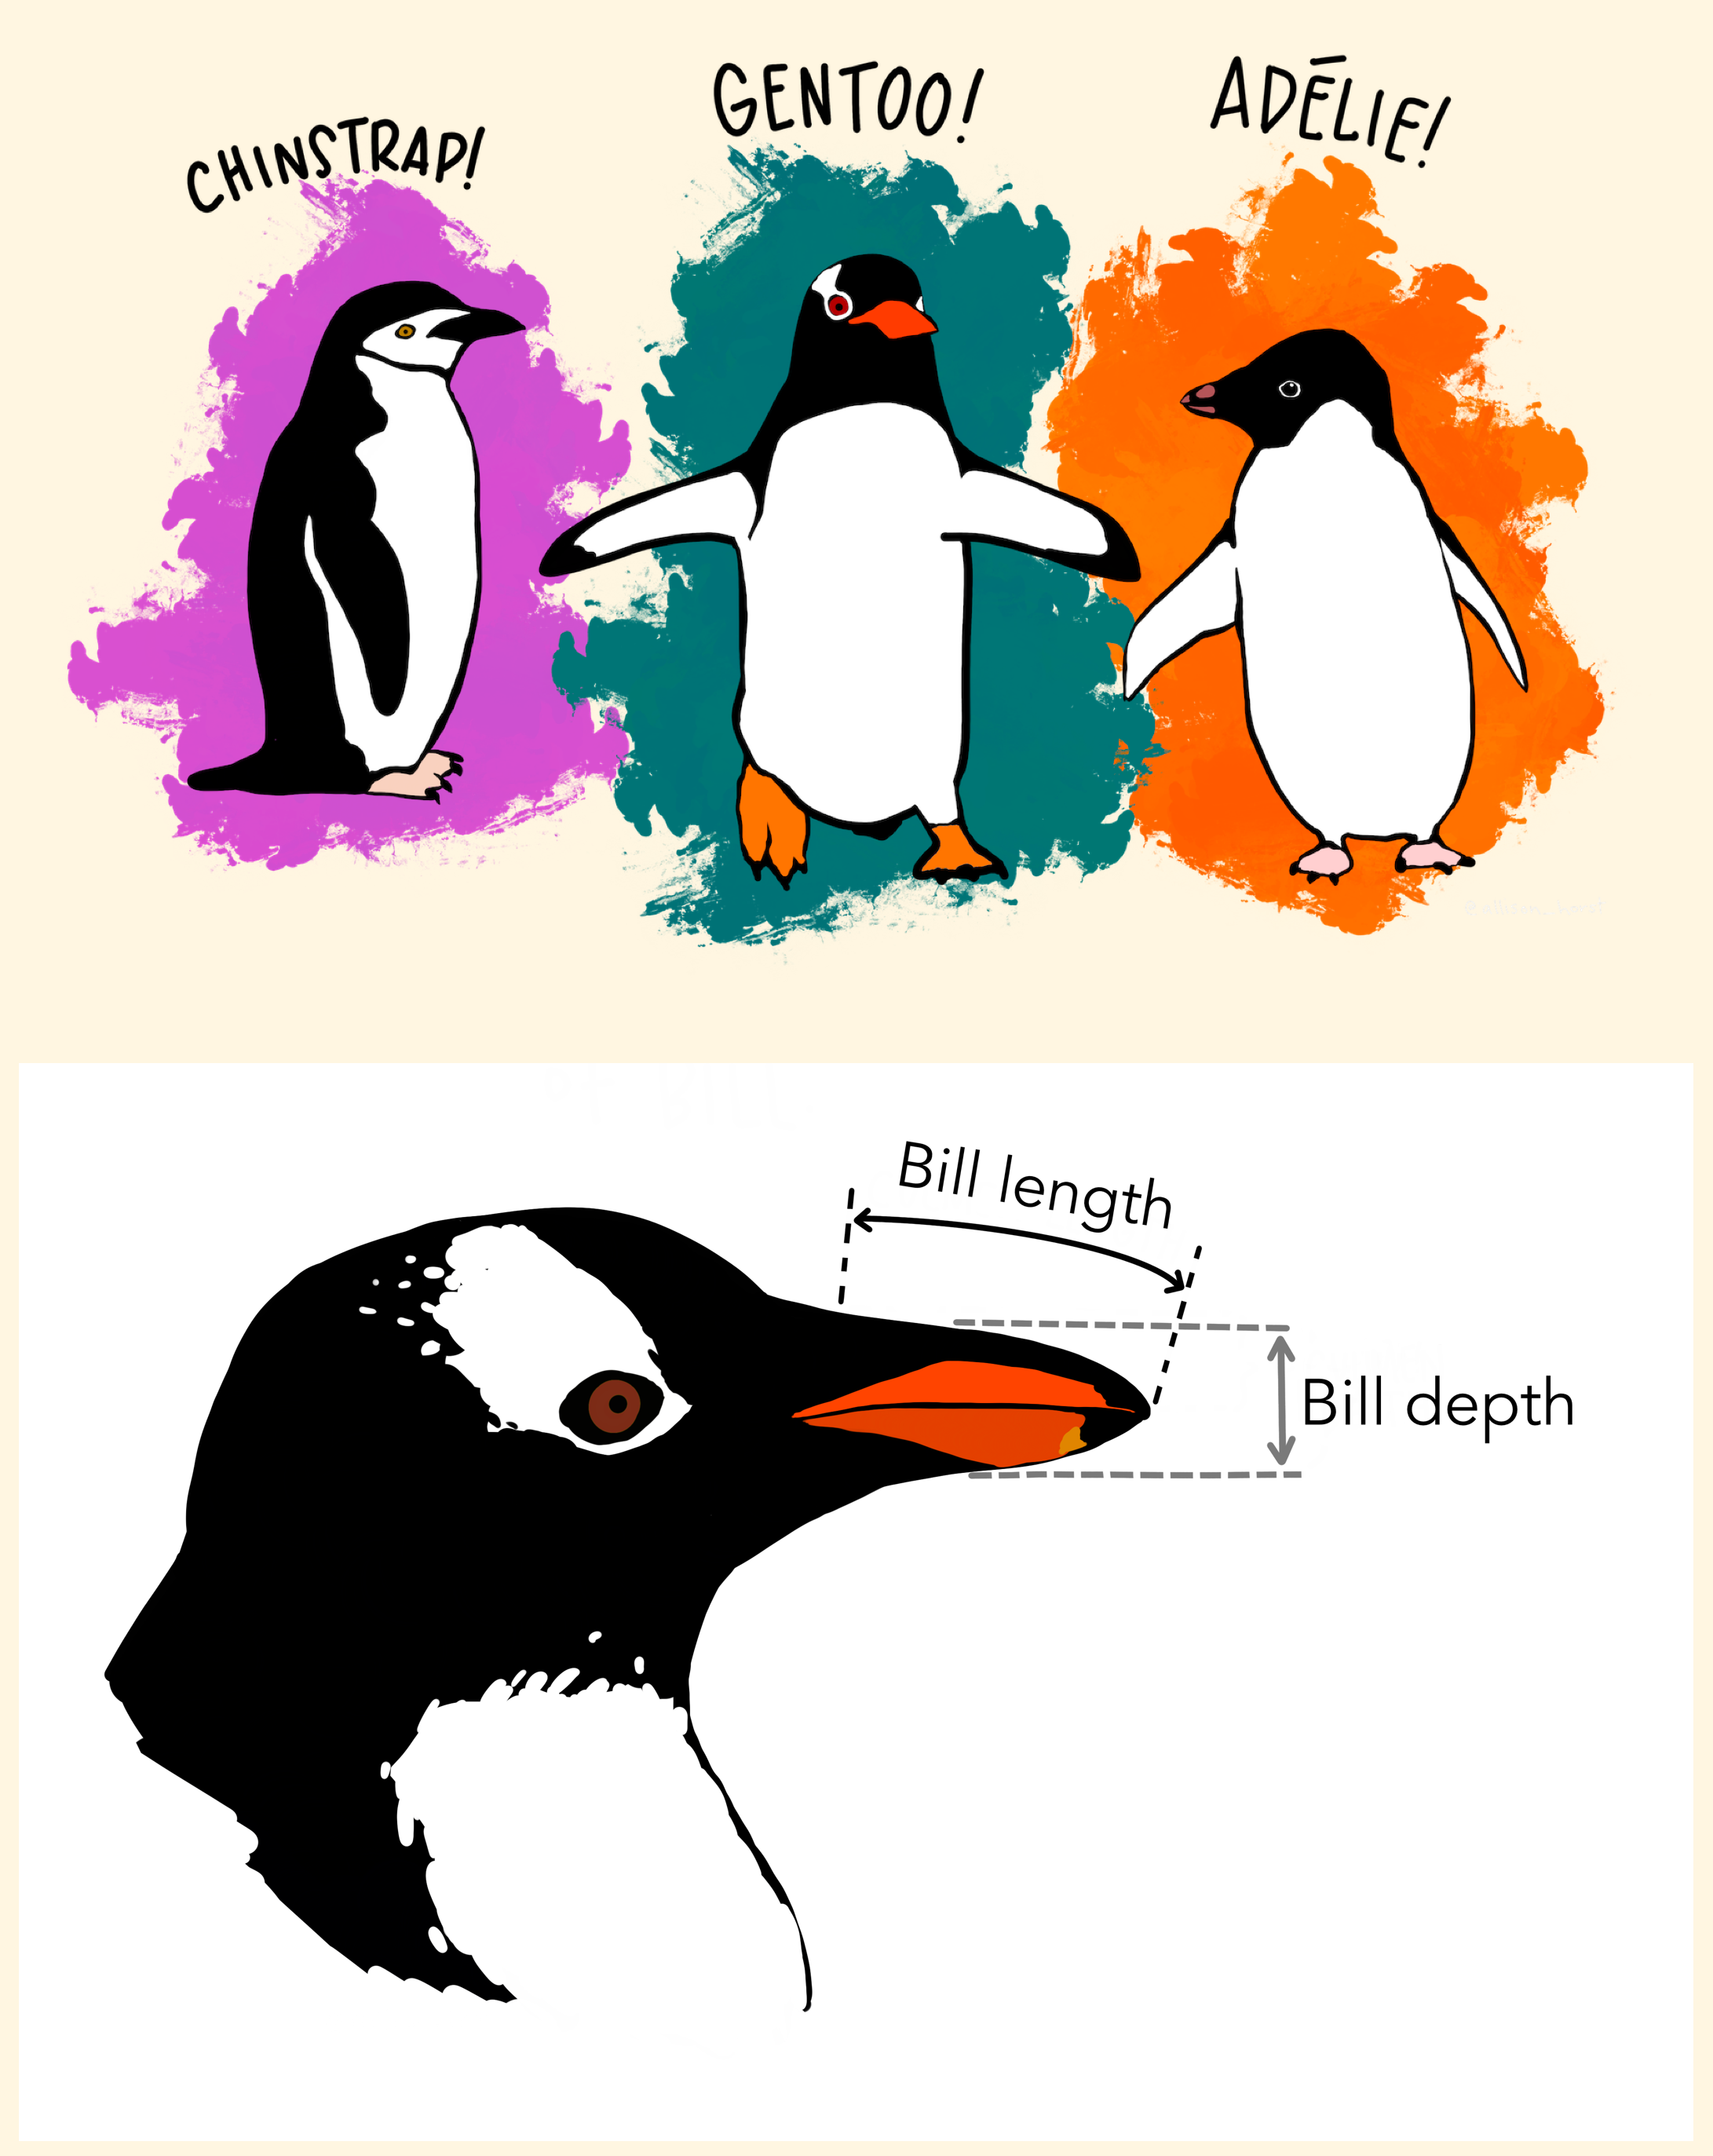
Data: Palmer Penguins
Measurements for penguin species, island in Palmer Archipelago, size (flipper length, body mass, bill dimensions), and sex.
Rows: 344
Columns: 8
$ species           <fct> Adelie, Adelie, Adelie, Adelie, Adelie, Adelie, Adel…
$ island            <fct> Torgersen, Torgersen, Torgersen, Torgersen, Torgerse…
$ bill_length_mm    <dbl> 39.1, 39.5, 40.3, NA, 36.7, 39.3, 38.9, 39.2, 34.1, …
$ bill_depth_mm     <dbl> 18.7, 17.4, 18.0, NA, 19.3, 20.6, 17.8, 19.6, 18.1, …
$ flipper_length_mm <int> 181, 186, 195, NA, 193, 190, 181, 195, 193, 190, 186…
$ body_mass_g       <int> 3750, 3800, 3250, NA, 3450, 3650, 3625, 4675, 3475, …
$ sex               <fct> male, female, female, NA, female, male, female, male…
$ year              <int> 2007, 2007, 2007, 2007, 2007, 2007, 2007, 2007, 2007…
Goal
An improved goal
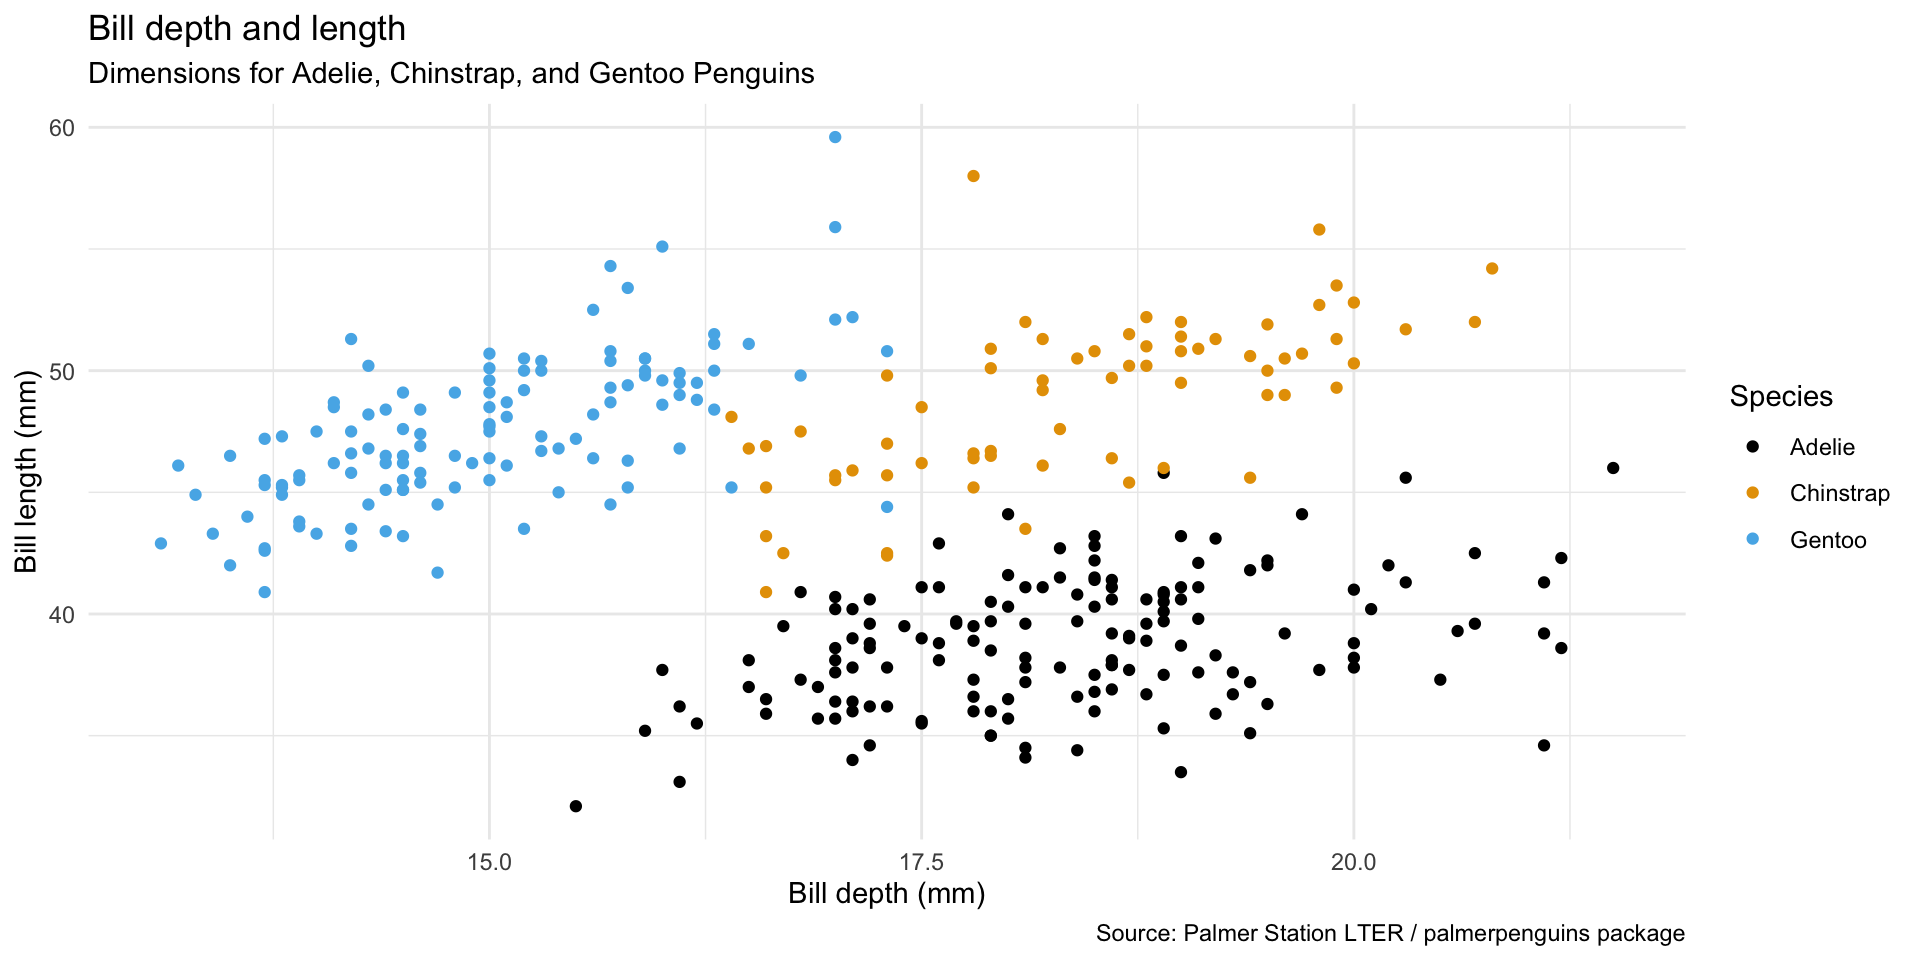
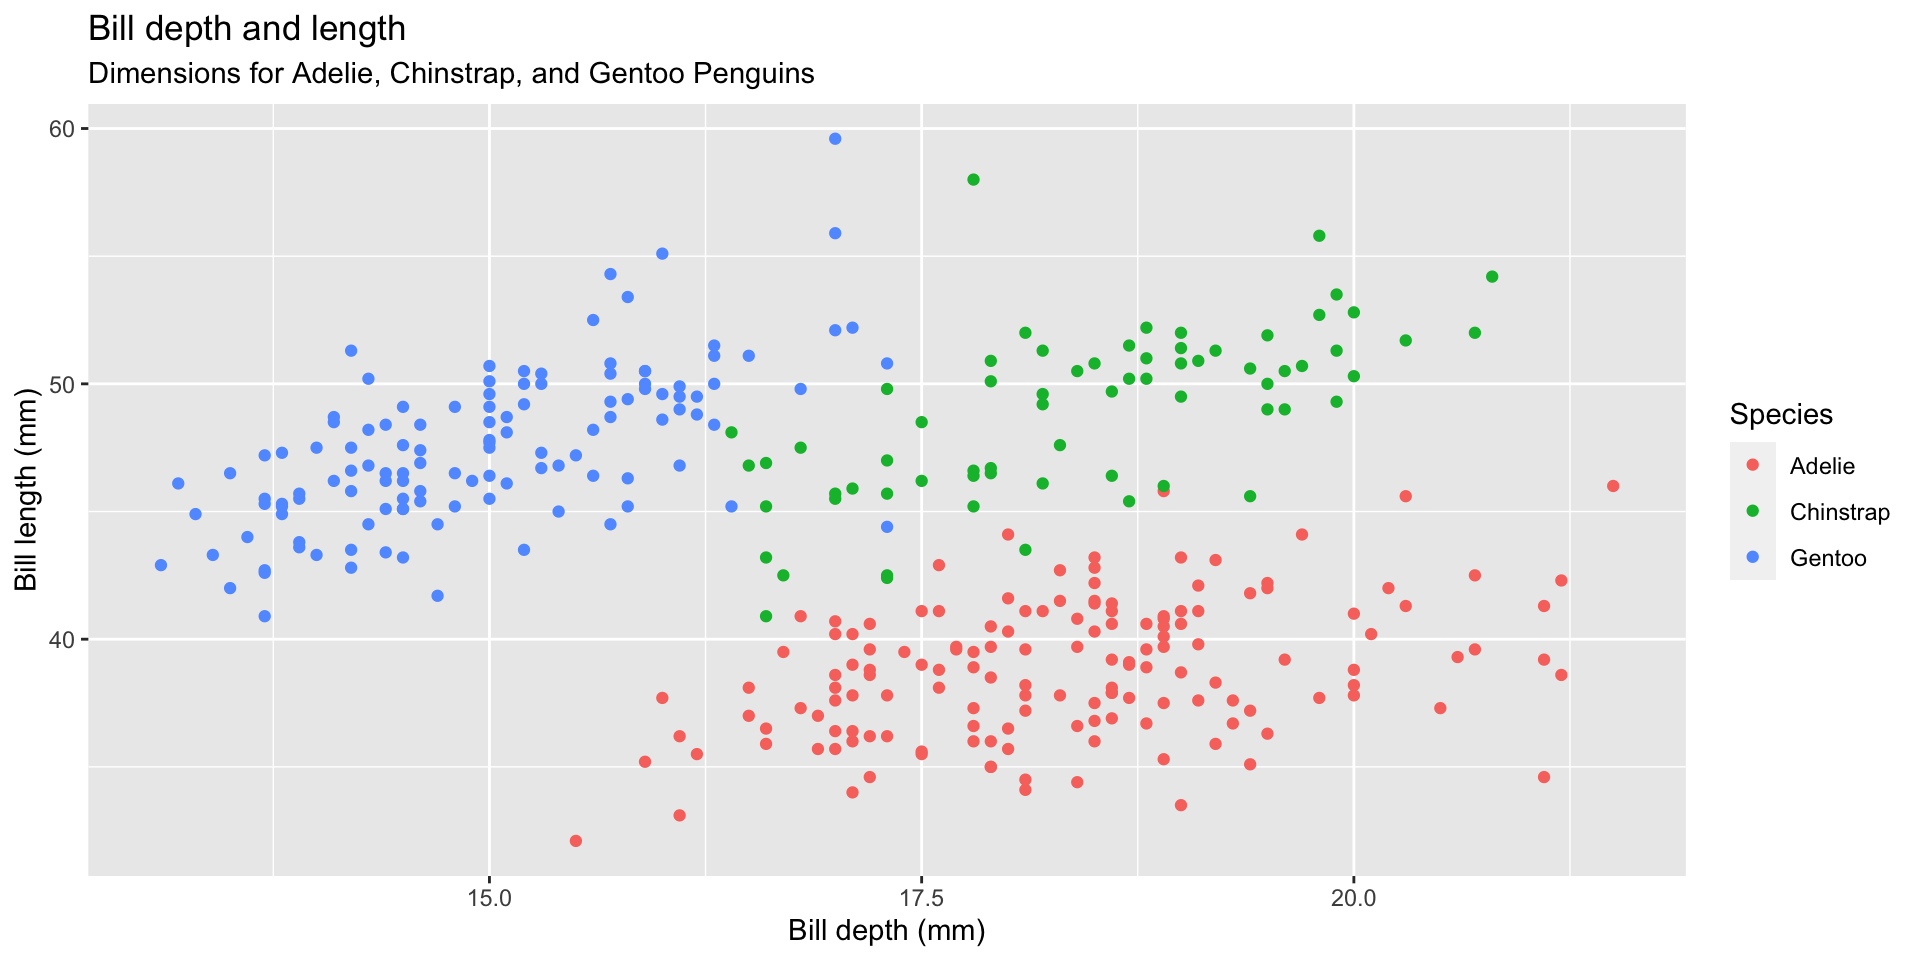
ggplot(
  penguins,
  aes(x = bill_depth_mm,y = bill_length_mm,colour = species)) +
  geom_point() +
  labs(
    title = "Bill depth and length",
    subtitle = "Dimensions for Adelie, Chinstrap, and Gentoo Penguins",
    x = "Bill depth (mm)", y = "Bill length (mm)",
    colour = "Species",
    caption = "Source: Palmer Station LTER / palmerpenguins package"
  ) +
  theme_minimal() +
  ggthemes::scale_color_colorblind()
Start with the penguins data frame, map bill depth to the x-axis and map bill length to the y-axis.
Represent each observation with a point and map species to the colour of each point.
Title the plot “Bill depth and length”, add the subtitle “Dimensions for Adelie, Chinstrap, and Gentoo Penguins”, label the x and y axes as “Bill depth (mm)” and “Bill length (mm)”, respectively, label the legend “Species”, and add a caption for the data source.
Finally, use a discrete colour scale that is designed to be perceived by viewers with common forms of colour blindness.
![]()